Grafana Loki |
94% SW Score The SW Score ranks the products within a particular category on a variety of parameters, to provide a definite ranking system. Read more
View Details
|
98% SW Score The SW Score ranks the products within a particular category on a variety of parameters, to provide a definite ranking system. Read more
View Details
|
96% SW Score The SW Score ranks the products within a particular category on a variety of parameters, to provide a definite ranking system. Read more
View Details
|
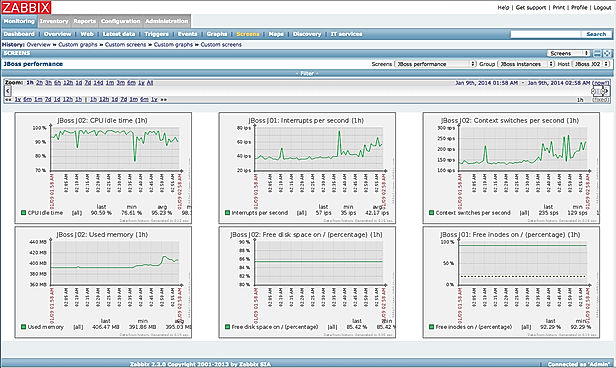
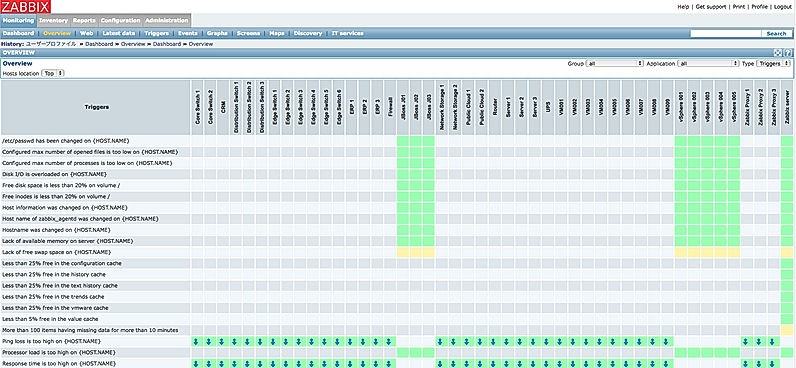
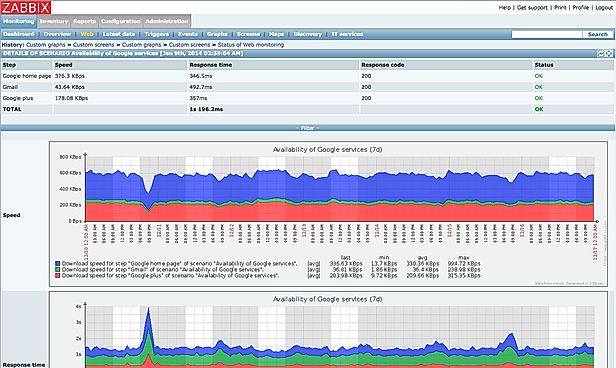
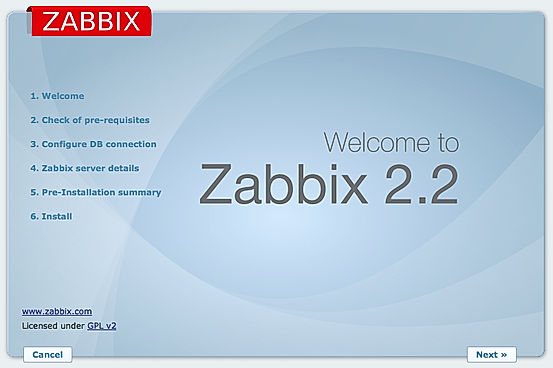
| Description | Zabbix is a network monitoring software that allows real-time network performance monitoring and management.You can monitor internet usage, bandwidth, IP address, uptime, server etc.The software comes designed with real time analytics, diagnostic tools and web traffic reporting.It helps in resource management as well.The platform is highly scalable. Zabbix Monitoring Solution notifies you if the power supply is critical, device temperature is excessively high/low, low free disk space etc.The tool is optimized for better performance and allows 3rd party software integration. It further includes features like security authentication, templating, autodiscovery etc. Read more | New Relic is a popular application management software that was established by Lew Cirne in 2008. In the last few years, New Relic has spread across the globe and is currently an integral tool for all IT industries and business executives. This software lets users monitor apps and address critical issues before they affect end-users. It supports languages like Python, Java, PHP, and NET. New Relic offers its services in several places across the globe. So suppose a site is working in Sydney but users want to find out if it is available in Tokyo as well, they can do so in a few seconds using the simple and free ping checks which gives detailed information about the availability of the site in a particular country. Users can send calls to APIs and confirm that each output and system response is successfully returned from multiple locations across the world. On noticing any errors in the software, users can take actual screenshots of the errors and send it to the creators of New Relic. Read more | Grafana is software that assists companies to monitor everything from Prometheus & Graphite metrics, logs, applications, beehives, power plants, sourdough starters, and custom data sources. It makes metric visualization tools that are more accessible and easy to use across the entire company. Grafana cloud plan collects, analyzes, and alerts users on Graphite and Prometheus metrics and Loki logs on highly available, high-performance, and fully managed Grafana Cloud platforms. Users can get visibility into all data sources and metrics across their teams without jumping through multiple tabs and tools. The platform enables users to get massive query performance and high efficiency for their Prometheus metrics at any scale. Users can also access Grafana Enterprise, which includes access to enterprise plugins that take users' existing data sources and allow them to drop them right into Grafana. This will enable users to get the best out of their complicated and expensive monitoring solutions and databases by visualizing all the data more easily and effectively. Read more |
| Pricing Options |
|
|
|
| SW Score & Breakdown |
94% SW Score The SW Score ranks the products within a particular category on a variety of parameters, to provide a definite ranking system. Read more
|
98% SW Score The SW Score ranks the products within a particular category on a variety of parameters, to provide a definite ranking system. Read more
|
96% SW Score The SW Score ranks the products within a particular category on a variety of parameters, to provide a definite ranking system. Read more
|
| SaaSworthy Awards |
Not Available
|
Not Available
|
# 5 Fastest Growing # 2 Most Popular |
| Organization Types Supported |
|
|
|
| Platforms Supported |
|
|
|
| Modes of Support |
|
|
|
| API Support |
|
|
|
| User Rating |
|
|
|
| Rating Distribution |
|
|
|
| User Sentiments |
Customizable Monitoring, Comprehensive Monitoring Capabilities, Open Source, Real-Time Alerting Steep Learning Curve, Outdated User Interface, Complicated Setup Process, Limited Reporting Functionality |
Detailed Performance Insights, Comprehensive Performance Monitoring, User-Friendly Interface, Effective Alerting System Mobile App Performance Issues, High Pricing, Complex User Interface, Lack of Log Access |
Easy to Use Interface, Extensive Customization Options, Powerful Visualization Capabilities, Wide Range of Data Source Integrations Steep Learning Curve, Slow Loading Times, Limited Alerting Functionality, Complex Querying Language |
| Review Summary |
Overall, users find the software easy to use, praising its intuitive interface, user-friendly dashboards, and customizable features. It is lauded for its comprehensive monitoring capabilities, including network monitoring, server monitoring, and application monitoring, with users appreciating its ability to detect and alert on issues promptly. However, some users have reported occasional bugs and performance issues, and a few have expressed concerns about the complexity of the software and the need for specialized skills for full utilization. |
Overall, users find the platform comprehensive and easy to use, praising its intuitive interface, customizable dashboards, and extensive monitoring capabilities. They appreciate the real-time data and alerting system, which helps them quickly identify and resolve issues. However, some users express concerns about the potential complexity for non-technical users and the occasional glitches or bugs they encounter. Additionally, a few users find the pricing to be on the higher side, especially for smaller teams or organizations. |
Grafana is widely praised for its powerful visualization capabilities, allowing users to create custom dashboards that provide insightful views of data from a variety of sources. Users appreciate its flexibility, extensive plugin library, and ease of integration with various monitoring tools. However, some users find the initial setup and configuration process complex, and point to limitations in its alerting capabilities. Despite these drawbacks, Grafana remains a popular choice for monitoring and analysis, particularly for those seeking a customizable open-source solution. |
| Read All User Reviews | Read All User Reviews | Read All User Reviews |
AI-Generated from the text of User Reviews
| Pricing Options |
|
|
|
|
Pricing Plans
Monthly Plans
Annual Plans
|
Zabbix Free |
Essentials Others Pro Others |
Free Forever Free Pro $19.00 $19.00 per month Advanced $299.00 $299.00 per month Enterprise Custom |
|
View Detailed Pricing
|
View Detailed Pricing
|
View Detailed Pricing
|
Get personalized recommendations from our experts on call
Trusted by more than 5 Million users across the globe.
Thank you for the enquiry. One of our software analysts will contact you soon.
| Screenshots |
+ 3 More
|

+ 7 More
|

+ 3 More
|
| Videos |

|

|

|
| Company Details | Located in: Riga, Latvia | Located in: San Francisco, CA | Located in: New York, New York Founded in: 2014 |
| Contact Details |
+371 6778-4742 |
(650) 777-7600 |
Not available |
| Social Media Handles |
|
|
|
Looking for the right SaaS
We can help you choose the best SaaS for your specific requirements. Our in-house experts will assist you with their hand-picked recommendations.
Want more customers?
Our experts will research about your product and list it on SaaSworthy for FREE.