Splunk App for Infrastructure |
97% SW Score The SW Score ranks the products within a particular category on a variety of parameters, to provide a definite ranking system. Read more
Visit Website
|
98% SW Score The SW Score ranks the products within a particular category on a variety of parameters, to provide a definite ranking system. Read more
Visit Website
|
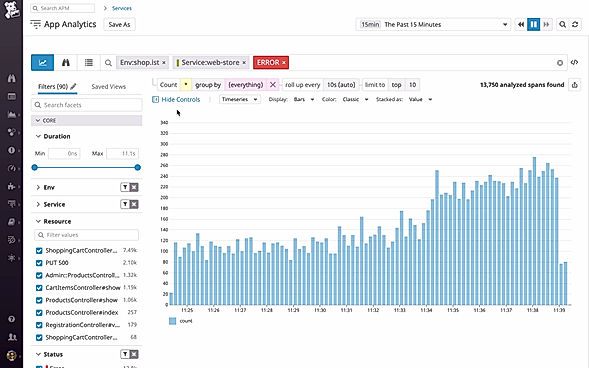
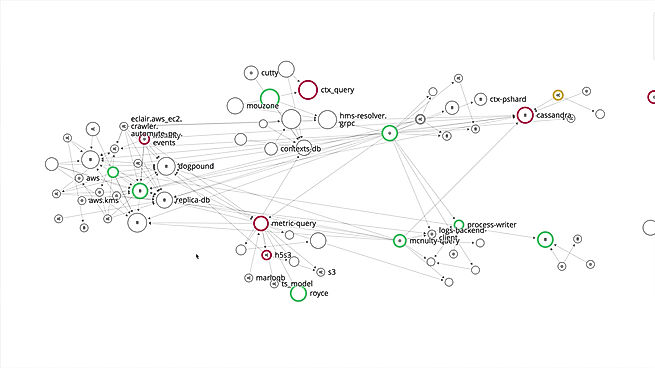
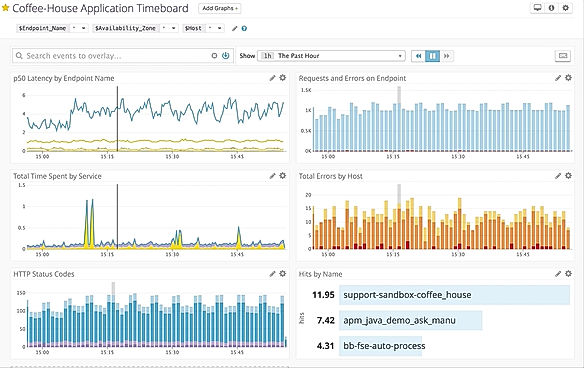
| Description | This is a cloud-based application monitoring tool for infrastructure, event logs, and applications. Users can search, collect and analyse traces across fully distributed platforms. This helps in narrowing down from a global perspective to one single customer’s particular line of code or request trace. This tool helps in tracking data flows automatically and cluster services based on their interdependencies in real-time. It also provides machine learning-based Watchdog to surface and auto-detect errors with zero configuration. Datadog APM can auto trace requests from any popular library or framework. Integrations with web frameworks such as Django, Ruby on Rails, Laravel, and Spring gives instant visibility into anomalies. Datadog also enables users to find traces that match a particular customer, user, error code, custom tag or service. Read more | New Relic is a popular application management software that was established by Lew Cirne in 2008. In the last few years, New Relic has spread across the globe and is currently an integral tool for all IT industries and business executives. This software lets users monitor apps and address critical issues before they affect end-users. It supports languages like Python, Java, PHP, and NET. New Relic offers its services in several places across the globe. So suppose a site is working in Sydney but users want to find out if it is available in Tokyo as well, they can do so in a few seconds using the simple and free ping checks which gives detailed information about the availability of the site in a particular country. Users can send calls to APIs and confirm that each output and system response is successfully returned from multiple locations across the world. On noticing any errors in the software, users can take actual screenshots of the errors and send it to the creators of New Relic. Read more |
| Pricing Options |
|
|
| SW Score & Breakdown |
97% SW Score The SW Score ranks the products within a particular category on a variety of parameters, to provide a definite ranking system. Read more
|
98% SW Score The SW Score ranks the products within a particular category on a variety of parameters, to provide a definite ranking system. Read more
|
| Total Features |
9 Features
|
12 Features
|
| Common Features for All |
API Monitoring
Alerts (Notifications)
Application Performance Metrics
Dashboard
Event Logs
Event-based Notification
Mobile User Monitoring
Page Speed Monitoring
Real-user Monitoring
SLA Monitoring
Synthetic Transaction Monitoring
Uptime Reporting
Web Defacement Monitoring
|
API Monitoring
Alerts (Notifications)
Application Performance Metrics
Dashboard
Event Logs
Event-based Notification
Mobile User Monitoring
Page Speed Monitoring
Real-user Monitoring
SLA Monitoring
Synthetic Transaction Monitoring
Uptime Reporting
Web Defacement Monitoring
|
| Organization Types Supported |
|
|
| Platforms Supported |
|
|
| Modes of Support |
|
|
| API Support |
|
|
| User Rating |
|
|
| Ratings Distribution |
|
|
| Review Summary |
Users appreciate Datadog's comprehensive monitoring capabilities, customizable dashboards, and user-friendly interface. They also value its ability to integrate with various tools and platforms, enabling seamless data collection and analysis. However, some users have expressed concerns regarding the complexity of setting up and configuring the tool, as well as its occasional performance issues and limited reporting capabilities. Overall, Datadog receives positive feedback for its robust monitoring features and integration options, but it could benefit from improvements in ease of use, performance stability, and reporting functionality. |
Overall, users find the platform comprehensive and easy to use, praising its intuitive interface, customizable dashboards, and extensive monitoring capabilities. They appreciate the real-time data and alerting system, which helps them quickly identify and resolve issues. However, some users express concerns about the potential complexity for non-technical users and the occasional glitches or bugs they encounter. Additionally, a few users find the pricing to be on the higher side, especially for smaller teams or organizations. |
| Pros & Cons |
|
|
| Read All User Reviews | Read All User Reviews |
AI-Generated from the text of User Reviews
| Pricing Options |
|
|
|
Pricing Plans
Monthly Plans
Annual Plans
|
APM and Distributed Tracing $31.00 $36.00 per user / month |
Essentials Others Pro Others |
|
View Detailed Pricing
|
View Detailed Pricing
|
|
APImetrics
5 Based on 4 Ratings |
New Relic Alerts
4.5 Based on 14 Ratings |
|
| Screenshots |
+ 2 More
|

+ 7 More
|
| Videos |
+ 1 More
|

|
| Company Details | Located in: New York, NY Founded in: 2010 | Located in: San Francisco, CA |
| Contact Details |
+1 866-329-4466 https://www.datadoghq.com/ |
(650) 777-7600 https://newrelic.com/products/application-monitoring |
| Social Media Handles |
|
|
What are the key differences between Datadog APM and New Relic APM?
Which product offers more extensive integration options?
How do the pricing models of these products compare?
Which product is better suited for large-scale monitoring?
How do the user interfaces of these products differ?
Looking for the right SaaS
We can help you choose the best SaaS for your specific requirements. Our in-house experts will assist you with their hand-picked recommendations.
Want more customers?
Our experts will research about your product and list it on SaaSworthy for FREE.