MEET CLARA - THE AI BEHIND SMARTER SOFTWARE CHOICES
|
88% SW Score The SW Score ranks the products within a particular category on a variety of parameters, to provide a definite ranking system. Read more 
View Details
|
93% SW Score The SW Score ranks the products within a particular category on a variety of parameters, to provide a definite ranking system. Read more 
View Details
|
86% SW Score The SW Score ranks the products within a particular category on a variety of parameters, to provide a definite ranking system. Read more 
View Details
|
95% SW Score The SW Score ranks the products within a particular category on a variety of parameters, to provide a definite ranking system. Read more 
View Details
|
| Description | Tableau is an integrated business intelligence and visual analytics solution that helps users analyse the key business data and find solutions to different problems. The platform can be used to obtain data from multiple sources, such as spreadsheets, databases, SQL and cloud apps, to generate meaningful insights. It helps users generate interactive maps and find necessary solutions to all their problems – whether they are analysts, students, teachers, executives or business owners. From connection to collaboration, the platform provides a secure, powerful and flexible end-to-end analytical approach, finding out AI-driven effective solutions. Tableau is capable to scale companies engaged in different industries, including manufacturing, communication, healthcare, education, technology and real estate. It is referred to as the world’s deepest and broadest analytics platform, compatible with Salesforce CRM. Other than English its is available in different global languages like Spanish, German, Italian, Portuguese and more. Read more | Microsoft Power BI is a data visualization platform that enables its users to create a data-driven culture equipped with business intelligence. The software helps its users to allow their employees at different organizational levels to use the up to the minute analytics in order to make quick and confident decisions. Users can share and create interactive data visuals throughout the data centers around the world, including the national clouds to hence meet the regulation and compliance requirements of the organization. Power BI allows its users to apply sensitivity labels that are recognizable through Office 365 apps such as Excel, Word, Outlook, and PowerPoint. The software allows its users to use the oversight of sensitive data through Microsoft Cloud App Security to ensure better compliance of regulatory and privacy requirements. Users can extend the governance and protection policies along with the exported data to the software with the help of Microsoft Information Protection. One can block risky user activities in real-time to prevent the exposure of sensitive data. Read more | SAS Business Intelligence helps to bring all the powerful insights related to the user’s business within their fingertips. The software helps users to seamlessly integrate and discover data on their own. They can create and share interactive reports with SAS Business Intelligence. This application offers easy-to-use analytics to its users. It also enables them to monitor the key metrics related to their business and take the necessary steps in case anything goes wrong. The compelling visuals provided by the software help users to quickly understand what the reports have to say. The software allows users to find the metrics that matter the most. SAS Business Analytics also helps users to expand their analytics culture. The software lets users enjoy the freedom of self-service data protection. It provides all the basic capabilities needed for data mashup, access, filtering and transformation with its BI tools. By using the software, users can create narratives and storyboards with ease and have meaningful conversations with their clients. Read more | Grafana is software that assists companies to monitor everything from Prometheus & Graphite metrics, logs, applications, beehives, power plants, sourdough starters, and custom data sources. It makes metric visualization tools that are more accessible and easy to use across the entire company. Grafana cloud plan collects, analyzes, and alerts users on Graphite and Prometheus metrics and Loki logs on highly available, high-performance, and fully managed Grafana Cloud platforms. Users can get visibility into all data sources and metrics across their teams without jumping through multiple tabs and tools. The platform enables users to get massive query performance and high efficiency for their Prometheus metrics at any scale. Users can also access Grafana Enterprise, which includes access to enterprise plugins that take users' existing data sources and allow them to drop them right into Grafana. This will enable users to get the best out of their complicated and expensive monitoring solutions and databases by visualizing all the data more easily and effectively. Read more |
| Pricing Options |
|
|
|
|
| SW Score & Breakdown |
88% SW Score The SW Score ranks the products within a particular category on a variety of parameters, to provide a definite ranking system. Read more
|
93% SW Score The SW Score ranks the products within a particular category on a variety of parameters, to provide a definite ranking system. Read more
|
86% SW Score The SW Score ranks the products within a particular category on a variety of parameters, to provide a definite ranking system. Read more
|
95% SW Score The SW Score ranks the products within a particular category on a variety of parameters, to provide a definite ranking system. Read more
|
| SaaSworthy Awards | # 1 Most Worthy # 4 Highly Rated | # 2 Most Worthy # 1 Highly Rated | # 7 Highly Rated | # 5 Fastest Growing # 2 Most Popular |
| Organization Types Supported |
|
|
|
|
| Platforms Supported |
|
|
|
|
| Modes of Support |
|
|
|
|
| API Support |
|
|
|
|
| User Rating |
Not Available
|
|
Not Available
|
Not Available
|
| Rating Distribution |
Not Available
|
|
Not Available
|
Not Available
|
| User Sentiments |
Intuitive User Interface, Extensive Data Visualization Capabilities, Extensive Data Source Integrations, Active User Community Frequent Software Updates, Performance Issues with Large Datasets, Limited ETL Capabilities, High Pricing |
Data Visualization Capabilities, Extensive Data Source Integrations, Intuitive and User-Friendly Interface, Data Sharing and Collaboration Mobile App Functionality, Occasional Software Bugs, Pricing Model Limitations, Complex Interface for Beginners |
Powerful Analytics, Data Visualization capabilities, Extensive Statistical features, Comprehensive Reporting High Cost, Steep Learning Curve, Outdated User Interface, Complex coding |
Easy to Use Interface, Extensive Customization Options, Powerful Visualization Capabilities, Wide Range of Data Source Integrations Steep Learning Curve, Slow Loading Times, Limited Alerting Functionality, Complex Querying Language |
| Review Summary |
Tableau is lauded for its user-friendly interface, enabling even non-technical users to create insightful visualizations and reports. Its drag-and-drop functionality and intuitive design streamline data analysis, making it accessible to users of all skill levels. Additionally, Tableau's wide range of data connectors and integrations with various data sources enhances its versatility and allows users to seamlessly incorporate data from multiple platforms. The platform's collaborative features, such as the ability to share dashboards and collaborate on projects, further enhance its appeal for teams seeking a collaborative data analysis solution. |
Users appreciate Power BI's user-friendly interface, extensive data visualization options, and seamless integration with other Microsoft products. Many reviewers highlight its ability to transform raw data into insightful reports and dashboards, aiding in better decision-making. Additionally, Power BI's collaboration features and mobile accessibility receive positive feedback. However, some users mention occasional performance issues and a learning curve for advanced features. While praised for its affordability and value for money, certain users suggest enhancements in customer support. |
SAS Business Intelligence is praised for its powerful analytics capabilities, user-friendly interface, and ability to handle large datasets. Users appreciate the ease of creating reports and dashboards, the drag-and-drop functionality, and seamless integration with various data sources. However, some find the learning curve steep, especially for those not well-versed in statistical concepts, and the cost can be prohibitive. Additionally, the software's dated user interface and occasional slow processing times are drawbacks. |
Grafana is widely praised for its powerful visualization capabilities, allowing users to create custom dashboards that provide insightful views of data from a variety of sources. Users appreciate its flexibility, extensive plugin library, and ease of integration with various monitoring tools. However, some users find the initial setup and configuration process complex, and point to limitations in its alerting capabilities. Despite these drawbacks, Grafana remains a popular choice for monitoring and analysis, particularly for those seeking a customizable open-source solution. |
| Pros & Cons |
|
|
|
|
| Read All User Reviews |
AI-Generated from the text of User Reviews
| Pricing Options |
|
|
|
|
|
Pricing Plans
Monthly Plans
Annual Plans
|
Tableau Creator Custom Tableau Explorer Custom Tableau Viewer Custom Enterprise Creator Custom Enterprise Explorer Custom Enterprise Viewer Custom Tableau+ Custom |
Free Account Free Power BI Pro $14.00 $14.00 per user / month Power BI Premium Per User $24.00 $24.00 per user / month Power BI Embedded Custom |
SAS Business Intelligence Custom |
Free Forever Free Pro $19.00 $19.00 per month Advanced $299.00 $299.00 per month Enterprise Custom |
|
View Detailed Pricing
|
View Detailed Pricing
|
View Detailed Pricing
|
View Detailed Pricing
|
Get personalized recommendations from our experts on call
Trusted by more than 5 Million users across the globe.
Thank you for the enquiry. One of our software analysts will contact you soon.
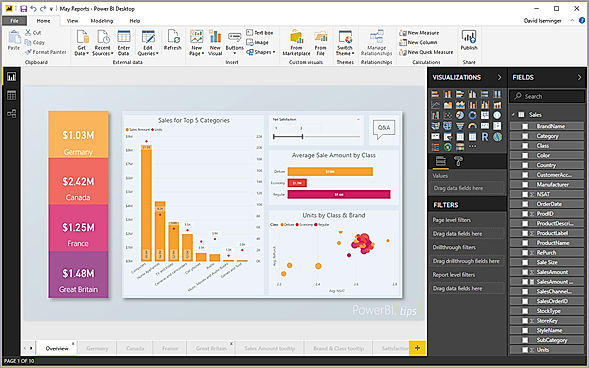
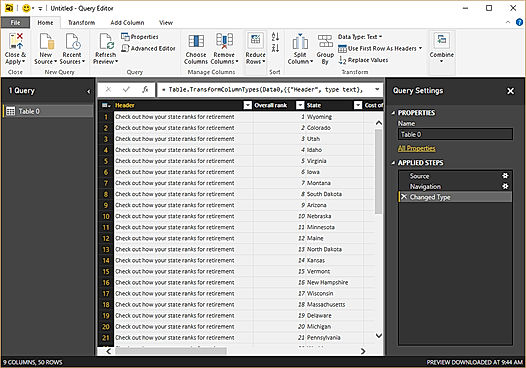
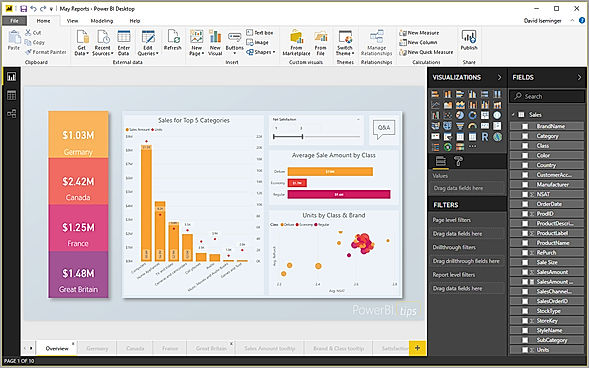
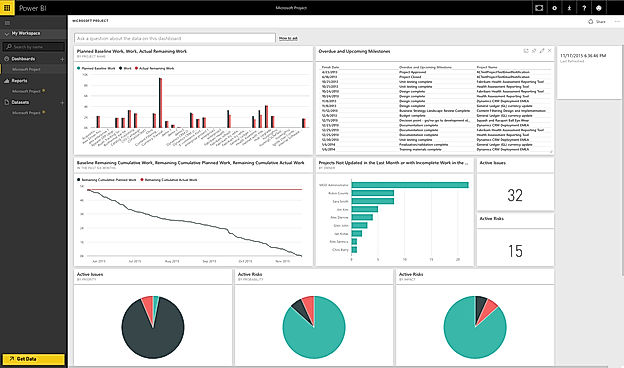
| Screenshots |
+ 3 More
|
+ 6 More
|

+ 3 More
|

+ 3 More
|
| Videos |
+ 1 More
|

+ 4 More
|
Not Available | Not Available |
| Company Details | Located in: Seattle, Washington Founded in: 2003 | Located in: Redmond, Washington Founded in: 2014 | Located in: Cary, North Carolina | Located in: New York, New York Founded in: 2014 |
| Contact Details |
+1 206-633-3400 |
Not available https://www.microsoft.com/en-us/power-platform/products/power-bi/ |
+1-800-727-0025 https://www.sas.com/en_us/solutions/business-intelligence.html |
Not available |
| Social Media Handles |
|
|
Not available |
|
What are the key differences between Tableau, Microsoft Power BI, SAS Business Intelligence, and Grafana?
What are the alternatives to Tableau?
Which SaaS products can Tableau integrate with?
Which product is better for large-scale data analysis?
How do the collaboration features of these products differ?

Looking for the right SaaS
We can help you choose the best SaaS for your specific requirements. Our in-house experts will assist you with their hand-picked recommendations.

Want more customers?
Our experts will research about your product and list it on SaaSworthy for FREE.