|
93% SW Score The SW Score ranks the products within a particular category on a variety of parameters, to provide a definite ranking system. Read more
Start Free Trial
|
98% SW Score The SW Score ranks the products within a particular category on a variety of parameters, to provide a definite ranking system. Read more
Start Free Trial
|
89% SW Score The SW Score ranks the products within a particular category on a variety of parameters, to provide a definite ranking system. Read more
View Details
|
Sponsored
84% SW Score The SW Score ranks the products within a particular category on a variety of parameters, to provide a definite ranking system. Read more ManageEngine Analytics Plus
Visit Website
|
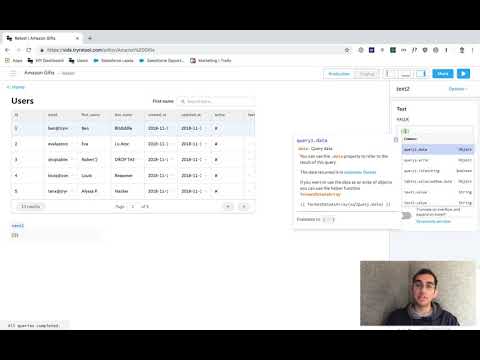
| Description | Tableau is an integrated business intelligence and visual analytics solution that helps users analyse the key business data and find solutions to different problems. The platform can be used to obtain data from multiple sources, such as spreadsheets, databases, SQL and cloud apps, to generate meaningful insights. It helps users generate interactive maps and find necessary solutions to all their problems – whether they are analysts, students, teachers, executives or business owners. From connection to collaboration, the platform provides a secure, powerful and flexible end-to-end analytical approach, finding out AI-driven effective solutions. Tableau is capable to scale companies engaged in different industries, including manufacturing, communication, healthcare, education, technology and real estate. It is referred to as the world’s deepest and broadest analytics platform, compatible with Salesforce CRM. Other than English its is available in different global languages like Spanish, German, Italian, Portuguese and more. Read more | Microsoft Power BI is a data visualization platform that enables its users to create a data-driven culture equipped with business intelligence. The software helps its users to allow their employees at different organizational levels to use the up to the minute analytics in order to make quick and confident decisions. Users can share and create interactive data visuals throughout the data centers around the world, including the national clouds to hence meet the regulation and compliance requirements of the organization. Power BI allows its users to apply sensitivity labels that are recognizable through Office 365 apps such as Excel, Word, Outlook, and PowerPoint. The software allows its users to use the oversight of sensitive data through Microsoft Cloud App Security to ensure better compliance of regulatory and privacy requirements. Users can extend the governance and protection policies along with the exported data to the software with the help of Microsoft Information Protection. One can block risky user activities in real-time to prevent the exposure of sensitive data. Read more | Retool is a platform that provides its users with building blocks to build internal tools for an organization, and hence save time. The software allows its users to build front-ends quickly around any kind of datastore. It connects to various SQL databases such as MySQL, BigQuery, Postgres, MS SQL, and Redshift as well as any other API, such as Salesforce and Google sheets, etc. Users can connect their data sources and build their queries and logic and queries in Javascript or SQL through the platform. One can connect their questions and logic to prebuilt components such as text inputs, tables, and buttons while also organizing and connecting their parts into an app. The apps created through the software are easy to share with stakeholders and term members of the users. The platform provides granular access management and audit logs in order to keep things secure. It also offers several integrations such as MySQL and PostgreSQL. Read more | Make your data more useful than ever before with advanced analytics and feature-rich dashboards from ManageEngine Analytics Plus. You can connect to any data source and upload files, spreadsheets, URL feeds and a lot more with absolute ease. Build complex reports on its easy-to-use interface and represent your data on a variety of charts, widgets and tabular views. You can also combine multiple reports and view it on a single dashboard and use its powerful formula engine to derive metrics from complex data and reports. Integrate with ManageEngine’s ITSM, support and IT support suite and get a better insight into your helpdesk and customer support operations. Read more |
| Pricing Options |
|
|
|
|
| SW Score & Breakdown |
93% SW Score The SW Score ranks the products within a particular category on a variety of parameters, to provide a definite ranking system. Read more
|
98% SW Score The SW Score ranks the products within a particular category on a variety of parameters, to provide a definite ranking system. Read more
|
89% SW Score The SW Score ranks the products within a particular category on a variety of parameters, to provide a definite ranking system. Read more
|
84% SW Score The SW Score ranks the products within a particular category on a variety of parameters, to provide a definite ranking system. Read more
|
| SaaSworthy Awards | # 1 Most Worthy # 4 Highly Rated | # 2 Most Worthy # 1 Highly Rated | # 4 Fastest Growing |
Not Available
|
| Organization Types Supported |
|
|
|
|
| Platforms Supported |
|
|
|
|
| Modes of Support |
|
|
|
|
| API Support |
|
|
|
|
| User Rating |
|
|
|
|
| Rating Distribution |
|
|
|
|
| User Sentiments |
Intuitive User Interface, Extensive Data Visualization Capabilities, Extensive Data Source Integrations, Active User Community Frequent Software Updates, Performance Issues with Large Datasets, Limited ETL Capabilities, High Pricing |
Data Visualization Capabilities, Extensive Data Source Integrations, Intuitive and User-Friendly Interface, Data Sharing and Collaboration Mobile App Functionality, Occasional Software Bugs, Pricing Model Limitations, Complex Interface for Beginners |
Not Available
|
Not Available
|
| Review Summary |
Tableau is lauded for its user-friendly interface, enabling even non-technical users to create insightful visualizations and reports. Its drag-and-drop functionality and intuitive design streamline data analysis, making it accessible to users of all skill levels. Additionally, Tableau's wide range of data connectors and integrations with various data sources enhances its versatility and allows users to seamlessly incorporate data from multiple platforms. The platform's collaborative features, such as the ability to share dashboards and collaborate on projects, further enhance its appeal for teams seeking a collaborative data analysis solution. |
Users appreciate Power BI's user-friendly interface, extensive data visualization options, and seamless integration with other Microsoft products. Many reviewers highlight its ability to transform raw data into insightful reports and dashboards, aiding in better decision-making. Additionally, Power BI's collaboration features and mobile accessibility receive positive feedback. However, some users mention occasional performance issues and a learning curve for advanced features. While praised for its affordability and value for money, certain users suggest enhancements in customer support. |
Retool is a highly praised no-code tool that goes beyond internal apps, allowing users to build various tools, dashboards, and workflows. While users appreciate its ease of use, intuitive interface, and extensive integrations, some note minor limitations such as a steep learning curve for beginners, performance issues with large applications, and occasionally buggy UI. Overall, Retool proves valuable for businesses looking to quickly develop and automate internal tools, saving significant development time and resources. |
Not Available
|
| Pros & Cons |
|
|
|
Not Available
|
| Read All User Reviews | Read All User Reviews | Read All User Reviews | Read All User Reviews |
AI-Generated from the text of User Reviews
| Pricing Options |
|
|
|
|
|
Pricing Plans
Monthly Plans
Annual Plans
|
Tableau Creator (For Individuals) $70.00 $70.00 per user / month Tableau Explorer (On-Premise or Public Cloud) $35.00 $35.00 per user / month Tableau Viewer (On-Premise or Public Cloud) $12.00 $12.00 per user / month Tableau Creator (Fully Hosted) $70.00 $70.00 per user / month Tableau Explorer (Fully Hosted) $42.00 $42.00 per user / month Tableau Viewer (Fully Hosted) $15.00 $15.00 per user / month Embedded Analytics Custom |
Power BI Pro $9.99 $9.99 per user / month Power BI Premium (User) $20.00 $20.00 per user / month Power BI Premium (Capacity) $4,995.00 $4,995.00 per month |
Free Free Team $10.00 $10.00 per user / month Business $50.00 $50.00 per user / month Enterprise Custom Free(Self-hosted) Free Starter (Self-hosted) $10.00 $10.00 per user / month Enterprise (Self-Hosted) Custom |
Personal edition Free Professional edition Perpetual $5,995.00 $5,995.00 One time payment Professional edition Annual Subscription $2,395.00 $2,395.00 per year |
|
View Detailed Pricing
|
View Detailed Pricing
|
View Detailed Pricing
|
View Detailed Pricing
|
|
|
|
|
||
| Screenshots |

+ 3 More
|

+ 6 More
|
+ 5 More
|
Not Available |
| Videos |

+ 2 More
|

+ 4 More
|
|

|
| Company Details | Located in: Seattle, Washington Founded in: 2003 | Located in: Redmond, Washington Founded in: 2014 | Located in: San Francisco, California | Located in: Pleasanton, USA |
| Contact Details |
+1 206-633-3400 https://www.tableau.com/ |
Not available https://powerbi.microsoft.com/ |
Not available https://retool.com/ |
+1-925-924-9500 https://www.manageengine.com/analytics-plus/ |
| Social Media Handles |
|
|
|
|
What are the key differences between Tableau and Microsoft Power BI?
What are the alternatives to Tableau?
Which SaaS products can Tableau integrate with?
Which product is better for large-scale data analysis?
How do the collaboration features of these products differ?
Looking for the right SaaS
We can help you choose the best SaaS for your specific requirements. Our in-house experts will assist you with their hand-picked recommendations.
Want more customers?
Our experts will research about your product and list it on SaaSworthy for FREE.