|
96% SW Score The SW Score ranks the products within a particular category on a variety of parameters, to provide a definite ranking system. Read more
View Details
|
98% SW Score The SW Score ranks the products within a particular category on a variety of parameters, to provide a definite ranking system. Read more
View Details
|
91% SW Score The SW Score ranks the products within a particular category on a variety of parameters, to provide a definite ranking system. Read more
View Details
|
96% SW Score The SW Score ranks the products within a particular category on a variety of parameters, to provide a definite ranking system. Read more
View Details
|
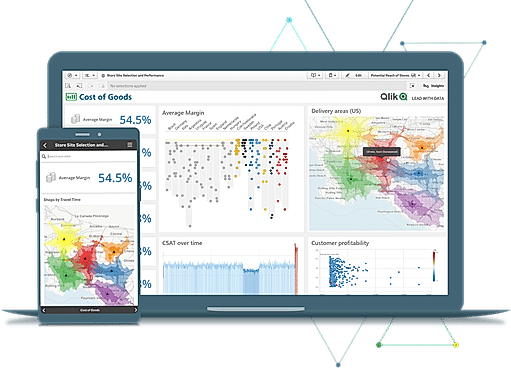
| Description | Qlik Sense is a smart analytics tool to generate personalized reports and dashboards instantly. It allows easy navigation through a huge amount of data and collects detailed information. It provides smart visualizations and can be integrated with the QIX engine which makes it more interactive. Also, it has a smart data load feature which enhances the ability to complete common tasks quickly with a click and go approach. It supports customization to meet unique business requirements. Along with this, it supports robust integration that can be used to transform and combine multiple data sources to provide smooth data analysis. Read more | Microsoft Power BI is a data visualization platform that enables its users to create a data-driven culture equipped with business intelligence. The software helps its users to allow their employees at different organizational levels to use the up to the minute analytics in order to make quick and confident decisions. Users can share and create interactive data visuals throughout the data centers around the world, including the national clouds to hence meet the regulation and compliance requirements of the organization. Power BI allows its users to apply sensitivity labels that are recognizable through Office 365 apps such as Excel, Word, Outlook, and PowerPoint. The software allows its users to use the oversight of sensitive data through Microsoft Cloud App Security to ensure better compliance of regulatory and privacy requirements. Users can extend the governance and protection policies along with the exported data to the software with the help of Microsoft Information Protection. One can block risky user activities in real-time to prevent the exposure of sensitive data. Read more | QlikView is a powerful BI platform that provides its users with an analytics solution for developing highly interactive guided analytics applications and dashboards. These are designed to deliver insight to solve various business challenges. The software allows its users to move data at scale in real-time without tasking source systems and efficiently providing data to the cloud and beyond. Users can automate the process from raw to analytics-ready data by getting agility and scale, automating your data warehouse, or data lake. One can eliminate complex scripting, build trust, and reduce errors. QlikView allows its users to make data easily accessible with enterprise data catalog by delivering trusted, governed access to all the correct data with an easy way for users to find, prepare, and use actionable data. Users can explore without boundaries as the Associative Engine indexes every relationship in the data of the users. The powerful AI offered by the software accelerates discoveries and raises data literacy, automates processes, and surfaces contextual insights. Read more | Grafana is software that assists companies to monitor everything from Prometheus & Graphite metrics, logs, applications, beehives, power plants, sourdough starters, and custom data sources. It makes metric visualization tools that are more accessible and easy to use across the entire company. Grafana cloud plan collects, analyzes, and alerts users on Graphite and Prometheus metrics and Loki logs on highly available, high-performance, and fully managed Grafana Cloud platforms. Users can get visibility into all data sources and metrics across their teams without jumping through multiple tabs and tools. The platform enables users to get massive query performance and high efficiency for their Prometheus metrics at any scale. Users can also access Grafana Enterprise, which includes access to enterprise plugins that take users' existing data sources and allow them to drop them right into Grafana. This will enable users to get the best out of their complicated and expensive monitoring solutions and databases by visualizing all the data more easily and effectively. Read more |
| Pricing Options |
|
|
|
|
| SW Score & Breakdown |
96% SW Score The SW Score ranks the products within a particular category on a variety of parameters, to provide a definite ranking system. Read more
|
98% SW Score The SW Score ranks the products within a particular category on a variety of parameters, to provide a definite ranking system. Read more
|
91% SW Score The SW Score ranks the products within a particular category on a variety of parameters, to provide a definite ranking system. Read more
|
96% SW Score The SW Score ranks the products within a particular category on a variety of parameters, to provide a definite ranking system. Read more
|
| SaaSworthy Awards | # 2 Highly Rated # 5 Fastest Growing | # 2 Most Worthy # 1 Highly Rated | # 17 Highly Rated | # 5 Fastest Growing # 2 Most Popular |
| Organization Types Supported |
|
|
|
|
| Platforms Supported |
|
|
|
|
| Modes of Support |
|
|
|
|
| API Support |
|
|
|
|
| User Rating |
|
|
|
|
| Rating Distribution |
|
|
|
|
| User Sentiments |
Fast Data Processing, Interactive Dashboards, Intuitive User Interface, Extensive Integrations Sluggish Performance with Large Datasets, Limited Customization Options, Complex Scripting Language, Poor Mobile Experience |
Data Visualization Capabilities, Extensive Data Source Integrations, Intuitive and User-Friendly Interface, Data Sharing and Collaboration Mobile App Functionality, Occasional Software Bugs, Pricing Model Limitations, Complex Interface for Beginners |
Intuitive User Interface, Data Visualization Capabilities, Extensive Data Source Connectivity, Powerful Data Handling Steep Learning Curve, Outdated User Interface, Limited Self-Service Functionality, Performance Issues with Large Datasets |
Easy to Use Interface, Extensive Customization Options, Powerful Visualization Capabilities, Wide Range of Data Source Integrations Steep Learning Curve, Slow Loading Times, Limited Alerting Functionality, Complex Querying Language |
| Review Summary |
Overall, users find the product easy to use and visually appealing, praising its intuitive interface and customizable dashboards. They commend its data visualization capabilities, enabling them to create interactive and visually appealing reports. Additionally, users appreciate the drag-and-drop functionality and the wide range of available connectors, making it easy to integrate with other systems. However, some users report performance issues, particularly with large datasets. They also mention the need for improved customer support and documentation, as well as more advanced features for data analysis and machine learning. |
Users appreciate Power BI's user-friendly interface, extensive data visualization options, and seamless integration with other Microsoft products. Many reviewers highlight its ability to transform raw data into insightful reports and dashboards, aiding in better decision-making. Additionally, Power BI's collaboration features and mobile accessibility receive positive feedback. However, some users mention occasional performance issues and a learning curve for advanced features. While praised for its affordability and value for money, certain users suggest enhancements in customer support. |
The consensus among reviewers is that QlikView is a robust and flexible business intelligence and data visualization tool that enables users to create interactive dashboards and reports from various data sources. It is praised for its ease of use, drag-and-drop functionality, and ability to handle large datasets. However, some users have mentioned that the software can be expensive and may require a steep learning curve for advanced features. Additionally, some reviewers have reported occasional issues with data connectivity and performance. Overall, QlikView is considered a powerful tool for data analysis and visualization, but it may not be the most cost-effective option for small businesses or users with limited technical expertise. |
Grafana is widely praised for its powerful visualization capabilities, allowing users to create custom dashboards that provide insightful views of data from a variety of sources. Users appreciate its flexibility, extensive plugin library, and ease of integration with various monitoring tools. However, some users find the initial setup and configuration process complex, and point to limitations in its alerting capabilities. Despite these drawbacks, Grafana remains a popular choice for monitoring and analysis, particularly for those seeking a customizable open-source solution. |
| Read All User Reviews | Read All User Reviews | Read All User Reviews | Read All User Reviews |
AI-Generated from the text of User Reviews
| Pricing Options |
|
|
|
|
|
Pricing Plans
Monthly Plans
Annual Plans
|
Qlik Sense Custom |
Free Account Free Power BI Pro $14.00 $14.00 per user / month Power BI Premium Per User $24.00 $24.00 per user / month Power BI Embedded Custom |
QlikView Custom |
Free Forever Free Pro $19.00 $19.00 per month Advanced $299.00 $299.00 per month Enterprise Custom |
|
View Detailed Pricing
|
View Detailed Pricing
|
View Detailed Pricing
|
View Detailed Pricing
|
Get personalized recommendations from our experts on call
Trusted by more than 5 Million users across the globe.
Thank you for the enquiry. One of our software analysts will contact you soon.
| Screenshots |
|

+ 6 More
|

|

+ 3 More
|
| Videos |

+ 2 More
|

+ 4 More
|
+ 1 More
|

|
| Company Details | Located in: King of Prussia, Pennsylvania | Located in: Redmond, Washington Founded in: 2014 | Located in: King of Prussia, Pennsylvania | Located in: New York, New York Founded in: 2014 |
| Contact Details |
+1 888-828-9768 |
Not available https://www.microsoft.com/en-us/power-platform/products/power-bi/ |
+1 (866) 616-4960 |
Not available |
| Social Media Handles |
|
|
|
|
Looking for the right SaaS
We can help you choose the best SaaS for your specific requirements. Our in-house experts will assist you with their hand-picked recommendations.
Want more customers?
Our experts will research about your product and list it on SaaSworthy for FREE.