|
91% SW Score The SW Score ranks the products within a particular category on a variety of parameters, to provide a definite ranking system. Read more
View Details
|
92% SW Score The SW Score ranks the products within a particular category on a variety of parameters, to provide a definite ranking system. Read more
View Details
|
96% SW Score The SW Score ranks the products within a particular category on a variety of parameters, to provide a definite ranking system. Read more
View Details
|
84% SW Score The SW Score ranks the products within a particular category on a variety of parameters, to provide a definite ranking system. Read more
View Details
|
| Description | This application performance management is a leader in the application performance and the IT sector. Established in 2001, eG Enterprise is currently monitoring services of over 180 applications including Java, SharePoint, Office 365 and more. Thousands of IT industries are reliant on this software to solve challenges like slow apps, hardware faults, code-level errors, and capacity issues. eG Enterprise helps developers and application managers to detect the root causes of issues and troubleshoot faster. As users access the application, this software monitors their digital experience and lets them know whenever their user experience gets affected. Reasons for code errors can also be identified and slow remote calls by using distributed transaction tracing and receive code-level visibility into applications. Users can also construct topology maps and auto-discover dependencies between underlying IT components such as cloud, virtualisation, container, network, and applications. Use machine learning and built-in correlative intelligence to isolate the root cause of slowdowns in performance. Read more | AppDynamics is an Application Performance Management Solution helping out organizations, in aligning their business outcomes with IT. It uses tools like CloudMonitoring, DevOps, Cloudmigration & unified Monitoring to gain the most efficient method of performance boosting. AppDynamics offers detailed observability facilitating enhanced business decisions, using modules like infrastructure monitoring, multi cloud monitoring, end user monitoring, network monitoring and more. Enterprises get access to mechanisms like dynamic baselining, application mapping and code-level diagnostics. An intuitive cognition engine within the particular uses machine learning to get anomalies detected in an automated manner. Moreover, enterprises also get to pinpoint the root cause of code-related issues and get them resolved in real-time. They can also analyze the performance levels of individual applications and their potential impact on business returns. The network monitoring solutions offered by AppDynamics, enables organizations to isolate the performance issues related to the networks which are in charge of driving particular business applications. Read more | Dynatrace lets users monitor, optimize, and scale their apps in any type of cloud. It provides software intelligence to accelerate digital transformation and simplify cloud complexity. Dynatrace is designed to monitor the performance of applications assigned to it and make them work better by improving their performance and availability. It lets users innovate faster, collaborate efficiently, and deliver more value with less effort. It provides APM with advanced observability across cloud and hybrid environments from microservices to mainframe. Dynatrace APM includes AIOps and infrastructure monitoring that delivers answers in no time across the full stack. Using Dynatrance, users can eliminate redundant manual work as it comes with dependency mapping, automatic full-stack instrumentation, and AI-assisted answers detailing the precise root-cause of anomalies. The tool is reliable and fast and uses many digital applications to stay relevant with technology. A business can use the software from any industry - retail, transportation, financial markets, emergency services, government bodies. Read more | Instana is an enterprise observability platform, developed to reduce the burden of application monitoring and manual observability of your Dev+Ops teams. With Instana's completely automated application observability, you'll be able to make sense of your disorganized cloud-native settings, providing the context you need to take intelligent decisions and maintain optimal application performance. Using Instana, you can monitor, trace, and profile all of your applications and services automatically. It gives you a complete picture of the application and its infrastructure along with undertaking intelligent steps to reduce troubleshooting and improve performance. To assist and improve application performance, you can fully automate application performance management with Instana. Users can predict issues and automate remediation using AI-assisted troubleshooting with Instana. With no human configuration, it automates discovery, mapping, and configuration along with profiling every process, tracing every request, and monitoring every service. It automatically captures and isolates browser faults, including JavaScript errors and combines web page data at the granular level with end-to-end services and infrastructure to improve the overall efficiency. Additionally, the platform easily supports all virtual, physical, and serverless operations and services. Read more |
| Pricing Options |
|
|
|
|
| SW Score & Breakdown |
91% SW Score The SW Score ranks the products within a particular category on a variety of parameters, to provide a definite ranking system. Read more
|
92% SW Score The SW Score ranks the products within a particular category on a variety of parameters, to provide a definite ranking system. Read more
|
96% SW Score The SW Score ranks the products within a particular category on a variety of parameters, to provide a definite ranking system. Read more
|
84% SW Score The SW Score ranks the products within a particular category on a variety of parameters, to provide a definite ranking system. Read more
|
| Total Features |
11 Features
|
9 Features
|
8 Features
|
6 Features
|
| Common Features for All |
API Monitoring
Alerts (Notifications)
Application Performance Metrics
Dashboard
Event Logs
Event-based Notification
Mail Server Monitoring
Mobile User Monitoring
Page Speed Monitoring
Real-user Monitoring
Synthetic Transaction Monitoring
Web Defacement Monitoring
|
API Monitoring
Alerts (Notifications)
Application Performance Metrics
Dashboard
Event Logs
Event-based Notification
Mail Server Monitoring
Mobile User Monitoring
Page Speed Monitoring
Real-user Monitoring
Synthetic Transaction Monitoring
Web Defacement Monitoring
|
API Monitoring
Alerts (Notifications)
Application Performance Metrics
Dashboard
Event Logs
Event-based Notification
Mail Server Monitoring
Mobile User Monitoring
Page Speed Monitoring
Real-user Monitoring
Synthetic Transaction Monitoring
Web Defacement Monitoring
|
API Monitoring
Alerts (Notifications)
Application Performance Metrics
Dashboard
Event Logs
Event-based Notification
Mail Server Monitoring
Mobile User Monitoring
Page Speed Monitoring
Real-user Monitoring
Synthetic Transaction Monitoring
Web Defacement Monitoring
|
| Organization Types Supported |
|
|
|
|
| Platforms Supported |
|
|
|
|
| Modes of Support |
|
|
|
|
| API Support |
|
|
|
|
| User Rating |
|
|
|
|
| Rating Distribution |
|
|
|
|
| User Sentiments |
Not Available
|
In-depth Performance Insights, Transaction Tracing, Real-Time Monitoring, Customizable Dashboards High Cost, Steep Learning Curve, Limited Log Management, Occasional Performance Issues |
Root Cause Analysis, Ease of Deployment, AI-Powered Insights, Comprehensive Monitoring High Cost, Complex UI/UX, Limited Customization Options, Steep Learning Curve |
Ease of Use, Microservice Monitoring, Detailed Performance Insights, Extensive Integrations Steep Learning Curve, Limited .NET Support, Occasional Support Delays, Instability After Updates |
| Review Summary |
Not Available
|
AppDynamics garners widespread praise for its robust application performance monitoring capabilities and insightful analytics that empower users to proactively identify and resolve performance issues. Reviewers commend its user-friendly interface, customizable dashboards, and ability to monitor complex IT environments effectively. Additionally, its real-time monitoring and alerting features are valued for enhancing observability and ensuring service availability. While some users mention occasional connectivity issues and a steep learning curve, the overall sentiment is positive, highlighting AppDynamics' effectiveness in optimizing application performance and ensuring business continuity. |
Overall, users praise Dynatrace for its real-time monitoring capabilities, comprehensive data analysis, and user-friendly interface. It is particularly valued for its AI-powered anomaly detection and root cause analysis, which help users identify and resolve issues quickly. Users appreciate the customizable dashboards and reporting features, which enable them to tailor the platform to their specific needs. Additionally, Dynatrace's integration with various cloud platforms and technologies is seen as a major advantage. However, some users have expressed concerns about the complexity of the platform and the need for specialized expertise to fully utilize its features. |
Instana's customer reviews reveal both strengths and weaknesses. Praises are directed towards its user-friendly interface, comprehensive features, and helpful customer support. The platform is lauded for its efficient installation and configuration processes, enabling quick integration into existing systems. However, some users have encountered challenges with the product's complexity, reporting occasional bugs and performance issues that require attention. Additionally, the pricing structure has been a concern for some, citing it as a potential barrier for wider adoption. |
| Read All User Reviews | Read All User Reviews | Read All User Reviews | Read All User Reviews |
AI-Generated from the text of User Reviews
| Pricing Options |
|
|
|
|
|
Pricing Plans
Monthly Plans
Annual Plans
|
Easy Evaluation (Cloud Deployed) Free Perpetual License (On-Premise) Custom Subscription (On-Premise) $300.00 $300.00 per month SaaS (Cloud Deployed) Custom Audit Service (On-Premise or Cloud) Custom |
APM Pro Custom APM Advanced Custom APM Peak Custom Real User Monitoring Pro Custom Real User Monitoring Peak Custom |
Full-stack monitoring Others Infrastructure monitoring Others Kubernetes Platform Monitoring Others Application security Others Real User Monitoring Others Synthetic Monitoring Others Log Management & Analytics Others |
Instana Custom |
|
View Detailed Pricing
|
View Detailed Pricing
|
View Detailed Pricing
|
View Detailed Pricing
|
Get personalized recommendations from our experts on call
Trusted by more than 5 Million users across the globe.
Thank you for the enquiry. One of our software analysts will contact you soon.
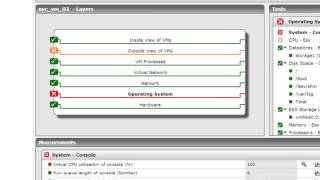
| Screenshots | Not Available |

+ 1 More
|

+ 5 More
|

+ 2 More
|
| Videos |
+ 2 More
|

+ 1 More
|

+ 1 More
|
+ 1 More
|
| Company Details | Located in: Iselin, New Jersey Founded in: 2001 | Located in: San Francisco, California Founded in: 2008 | Located in: Waltham, Massachusetts Founded in: 2005 | Located in: Chicago, Illinois Founded in: 2015 |
| Contact Details |
+1 866 526 6700 |
Not available |
+1 888 833 3652 |
+1 415-340-2777 |
| Social Media Handles |
|
|
|
|
Looking for the right SaaS
We can help you choose the best SaaS for your specific requirements. Our in-house experts will assist you with their hand-picked recommendations.
Want more customers?
Our experts will research about your product and list it on SaaSworthy for FREE.


