88% SW Score The SW Score ranks the products within a particular category on a variety of parameters, to provide a definite ranking system. Read more
Generate sequence, class or entity-relationship diagrams in real-time
This product profile is currently unclaimed.
The listing is published on SaaSworthy, but the official vendor does not yet manage it. Are you part of the Gleek team? Claim this profile to manage and update your product information.
Free Trial
Not available
The Average Cost of a basic Diagramming Software plan is $7 per month.
Gleek pricing starts at $9.95/month, which is 42% higher than similar services.
34% of Diagramming Software offer a Free Trial , while 62% offer a Freemium Model .
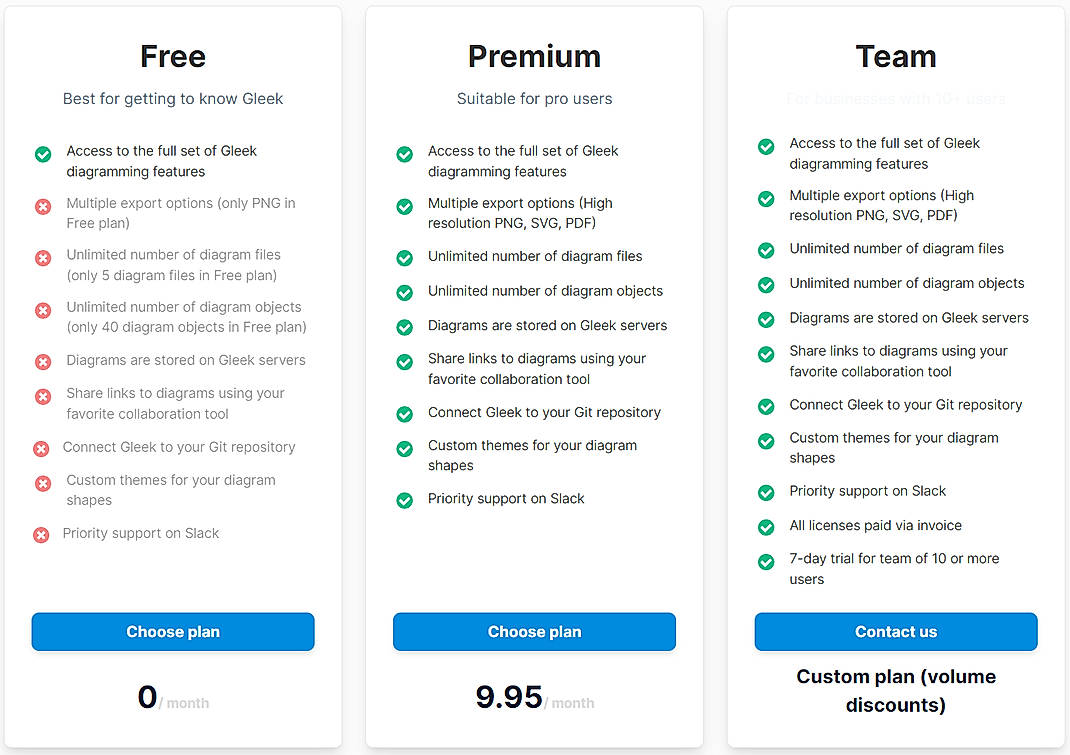
Free Free
Best for getting to know Gleek
Features
Premium $9.95 $9.95 per month
Suitable for pro users
Features
Team Custom
For businesses with 10+ users
Features
Screenshots of Vendor Pricing Page
How much does Gleek cost?
The pricing for Gleek starts at $9.95 per month. Gleek has a single plan:
Gleek offers a Free Plan with limited features. They also offer an Enterprise Plan for their product.
Learn more about Gleek pricing.
Does Gleek offer a free plan?
Yes, Gleek offers a free plan.
Learn more about Gleek pricing.
| Product Name | Starting Price ($) | Billed | Unit | Free Trial | Learn More |
|---|---|---|---|---|---|
|
|
9.95 | per month | - | Gleek Pricing | |
|
|
- | - | - | Quick Diagram Pricing | |
|
|
- | - | - | diagrams.net Pricing | |
|
|
5 | per month | - | DrawERD Pricing | |
|
|
19 | per month | - | DrawSQL Pricing | |
|
|
- | - | - | Designer Pricing | |
|
|
- | - | - | ERD Lab Pricing | |
|
|
- | - | - | yEd Graph Editor Pricing | |
|
|
7.9 | per month | - | QuickDBD Pricing | |
|
|
5 | per month | per user | UpDiagram Pricing |
98% SW Score The SW Score ranks the products within a particular category on a variety of parameters, to provide a definite ranking system. Read more
95% SW Score The SW Score ranks the products within a particular category on a variety of parameters, to provide a definite ranking system. Read more
92% SW Score The SW Score ranks the products within a particular category on a variety of parameters, to provide a definite ranking system. Read more
91% SW Score The SW Score ranks the products within a particular category on a variety of parameters, to provide a definite ranking system. Read more
91% SW Score The SW Score ranks the products within a particular category on a variety of parameters, to provide a definite ranking system. Read more
90% SW Score The SW Score ranks the products within a particular category on a variety of parameters, to provide a definite ranking system. Read more
90% SW Score The SW Score ranks the products within a particular category on a variety of parameters, to provide a definite ranking system. Read more
89% SW Score The SW Score ranks the products within a particular category on a variety of parameters, to provide a definite ranking system. Read more
94% SW Score The SW Score ranks the products within a particular category on a variety of parameters, to provide a definite ranking system. Read more
Featured78% SW Score The SW Score ranks the products within a particular category on a variety of parameters, to provide a definite ranking system. Read more
91% SW Score The SW Score ranks the products within a particular category on a variety of parameters, to provide a definite ranking system. Read more
86% SW Score The SW Score ranks the products within a particular category on a variety of parameters, to provide a definite ranking system. Read more
84% SW Score The SW Score ranks the products within a particular category on a variety of parameters, to provide a definite ranking system. Read more
85% SW Score The SW Score ranks the products within a particular category on a variety of parameters, to provide a definite ranking system. Read more
82% SW Score The SW Score ranks the products within a particular category on a variety of parameters, to provide a definite ranking system. Read more
91% SW Score The SW Score ranks the products within a particular category on a variety of parameters, to provide a definite ranking system. Read more
87% SW Score The SW Score ranks the products within a particular category on a variety of parameters, to provide a definite ranking system. Read more
Diagram Templates
Features templates or themes to help in creating diagrams without any hassleFlowchart
Helps in creating flowcharts to depict workflow, process steps or an algorithmData Import-Export
Helps in importing and exporting dataFor Developers
Helpful for Information Technology (IT) developers to design engaging applicationsOrganizational Charting
Helps in designing a chart that visually represents the internal structure of an organizationMind Map
Helps in creating mind maps to enable one capturing the thoughts and bringing them into reality in the visual formLooking for the right SaaS
We can help you choose the best SaaS for your specific requirements. Our in-house experts will assist you with their hand-picked recommendations.
Want more customers?
Our experts will research about your product and list it on SaaSworthy for FREE.