Supermetrics |
79% SW Score The SW Score ranks the products within a particular category on a variety of parameters, to provide a definite ranking system. Read more
View Details
|
81% SW Score The SW Score ranks the products within a particular category on a variety of parameters, to provide a definite ranking system. Read more
View Details
|
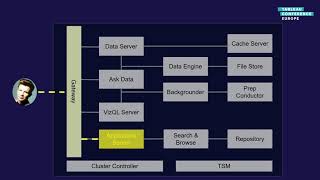
| Description | Tableau is a visual analytics platform. It is transforming the way people use data to solve problems—empowering people and organizations to make the most of their data. this is the broadest and deepest data and analytics platform. With Tableau, you can choose from on-premises or public cloud and configure servers, scale hardware capacity according to your requirements or manage software upgrades. You can connect to any data and turbocharge teamwork by discovering,collaborating, sharing, and exploring data from your mobile phone, tablet, or computer. This way you can build and scale mission-critical analytics while maintaining control with Tableau Server Management, which offers increased scalability, improved efficiency, and enhanced security.You can deliver trusted data with centralized governance, visibility, and control which ensures your data is in the right hands with easy, automated authentication and permissions management.To integrate data insights where you work- with embedded analytics, you can seamlessly embed data and insights into your products and applications which empower your users and customers with data-driven insights. Read more | Porter helps small businesses and agencies streamline marketing reporting. We're constructing a data visualization Zapier; transmit data from your everyday apps whenever you need it. Porter is designed to allow any marketer who has no prior experience with Google Data Studio to automate reporting in a matter of minutes. Track the performance of your stores and marketing channels in one place. With powerful, custom dashboards, you can take Google Search Console reporting to the next level. We make certain that you appear at the top of Google searches and that you remain visible. Follow the growth of your following on social media sites like Facebook, Instagram, and YouTube. Our objective is to help your business achieve new heights in your sector. You may modify any report template in Data Studio with your own colors, logo, icons, and fonts, making it feel like your own reporting tool rather than Data Studio. You can share your reports in a variety of ways, including converting them to PDF, sharing links, embedding them on any website, and even scheduling email delivery. Read more |
| Pricing Options |
|
|
| SW Score & Breakdown |
79% SW Score The SW Score ranks the products within a particular category on a variety of parameters, to provide a definite ranking system. Read more
|
81% SW Score The SW Score ranks the products within a particular category on a variety of parameters, to provide a definite ranking system. Read more
|
| Total Features |
3 Features
|
4 Features
|
| Common Features for All |
Ad hoc Analysis
Dashboard
Data Analysis
Key Performance Indicators
Strategic Planning
|
Ad hoc Analysis
Dashboard
Data Analysis
Key Performance Indicators
Strategic Planning
|
| Organization Types Supported |
|
|
| Platforms Supported |
|
|
| Modes of Support |
|
|
| API Support |
|
|
| User Rating |
Not Available
|
|
| Rating Distribution |
Not Available
|
|
| Read All User Reviews |
AI-Generated from the text of User Reviews
| Pricing Options |
|
|
|
Pricing Plans
Monthly Plans
Annual Plans
|
Tableau Viewer $12.00 $12.00 per user / month Tableau Explorer $35.00 $35.00 per user / month Tableau Creator $70.00 $70.00 per user / month |
Solo $12.50 $15.00 per month Team $25.00 $30.00 per month Agency $66.60 $80.00 per month Custom Custom Free Free |
|
View Detailed Pricing
|
View Detailed Pricing
|
Get personalized recommendations from our experts on call
Trusted by more than 5 Million users across the globe.
Thank you for the enquiry. One of our software analysts will contact you soon.
| Screenshots |

+ 4 More
|
Not Available |
| Videos |
|
+ 1 More
|
| Company Details | Located in: Seattle, Washington | Located in: Manizales, Colombia |
| Contact Details |
+1 206-633-3400 |
Not available |
| Social Media Handles |
|
|
Looking for the right SaaS
We can help you choose the best SaaS for your specific requirements. Our in-house experts will assist you with their hand-picked recommendations.
Want more customers?
Our experts will research about your product and list it on SaaSworthy for FREE.


