ManageEngine Desktop Central |
89% SW Score The SW Score ranks the products within a particular category on a variety of parameters, to provide a definite ranking system. Read more
View Details
|
79% SW Score The SW Score ranks the products within a particular category on a variety of parameters, to provide a definite ranking system. Read more
View Details
|
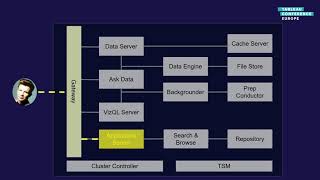
| Description | SplashBI is a platform that lets users create reports and dashboards which stand out. It empowers businesses to understand the full story behind their data through the business analytics platform. SplashBi empowers customers to make data-driven decisions using Actionable Intelligence. Users can access this platform on the cloud or premise. It comes with plenty of pre-built content consisting of reports, dashboards, and data models which can help the user get started immediately. The platform blends data across dozens of data sources instantly to publish complex and hidden insights across dozens of data sources. This can be done without undergoing any tedious or costly implementations. The in-built self-service reporting and analysis tool helps users ask the right questions regarding the data to generate the insights that are essential to keep business running and grow. They can create ad-hoc reports in multiple output formats. SplashBI allows the companies to get the big picture regarding their data with 100 different types of charts and present them in modernized custom dashboards. Read more | Tableau is a visual analytics platform. It is transforming the way people use data to solve problems—empowering people and organizations to make the most of their data. this is the broadest and deepest data and analytics platform. With Tableau, you can choose from on-premises or public cloud and configure servers, scale hardware capacity according to your requirements or manage software upgrades. You can connect to any data and turbocharge teamwork by discovering,collaborating, sharing, and exploring data from your mobile phone, tablet, or computer. This way you can build and scale mission-critical analytics while maintaining control with Tableau Server Management, which offers increased scalability, improved efficiency, and enhanced security.You can deliver trusted data with centralized governance, visibility, and control which ensures your data is in the right hands with easy, automated authentication and permissions management.To integrate data insights where you work- with embedded analytics, you can seamlessly embed data and insights into your products and applications which empower your users and customers with data-driven insights. Read more |
| Pricing Options |
|
|
| SW Score & Breakdown |
89% SW Score The SW Score ranks the products within a particular category on a variety of parameters, to provide a definite ranking system. Read more
|
79% SW Score The SW Score ranks the products within a particular category on a variety of parameters, to provide a definite ranking system. Read more
|
| SaaSworthy Awards | # 6 Fastest Growing |
Not Available
|
| Total Features |
9 Features
|
3 Features
|
| Common Features for All |
Ad hoc Analysis
Ad hoc Reports
Benchmarking
Dashboard
Data Analysis
Key Performance Indicators
Profitability Analysis
Strategic Planning
Trend Indicators
|
Ad hoc Analysis
Ad hoc Reports
Benchmarking
Dashboard
Data Analysis
Key Performance Indicators
Profitability Analysis
Strategic Planning
Trend Indicators
|
| Organization Types Supported |
|
|
| Platforms Supported |
|
|
| Modes of Support |
|
|
| API Support |
|
|
| User Rating |
|
Not Available
|
| Rating Distribution |
|
Not Available
|
| Read All User Reviews |
AI-Generated from the text of User Reviews
| Pricing Options |
|
|
|
Pricing Plans
Monthly Plans
Annual Plans
|
SplashBI Custom |
Tableau Viewer $12.00 $12.00 per user / month Tableau Explorer $35.00 $35.00 per user / month Tableau Creator $70.00 $70.00 per user / month |
|
View Detailed Pricing
|
View Detailed Pricing
|
Get personalized recommendations from our experts on call
Trusted by more than 5 Million users across the globe.
Thank you for the enquiry. One of our software analysts will contact you soon.
| Screenshots |

+ 3 More
|

+ 4 More
|
| Videos |
|
|
| Company Details | Located in: Duluth, Georgia Founded in: 2014 | Located in: Seattle, Washington |
| Contact Details |
+1 678-248-5756 |
+1 206-633-3400 |
| Social Media Handles |
|
|
Looking for the right SaaS
We can help you choose the best SaaS for your specific requirements. Our in-house experts will assist you with their hand-picked recommendations.
Want more customers?
Our experts will research about your product and list it on SaaSworthy for FREE.


