Snowflake |
89% SW Score The SW Score ranks the products within a particular category on a variety of parameters, to provide a definite ranking system. Read more
View Details
|
86% SW Score The SW Score ranks the products within a particular category on a variety of parameters, to provide a definite ranking system. Read more
View Details
|
| Description | QlikView is a powerful BI platform that provides its users with an analytics solution for developing highly interactive guided analytics applications and dashboards. These are designed to deliver insight to solve various business challenges. The software allows its users to move data at scale in real-time without tasking source systems and efficiently providing data to the cloud and beyond. Users can automate the process from raw to analytics-ready data by getting agility and scale, automating your data warehouse, or data lake. One can eliminate complex scripting, build trust, and reduce errors. QlikView allows its users to make data easily accessible with enterprise data catalog by delivering trusted, governed access to all the correct data with an easy way for users to find, prepare, and use actionable data. Users can explore without boundaries as the Associative Engine indexes every relationship in the data of the users. The powerful AI offered by the software accelerates discoveries and raises data literacy, automates processes, and surfaces contextual insights. Read more | The enterprise-grade data processing engines used by Qubole, a fully self-service multi-cloud data platform, include Apache Spark, Presto, Hive, Quantum, Airflow, and more. To reduce administrative burden, it automatically configures, manages, and optimises cloud resources while balancing cost, workloads, and performance requirements. It employs a multi-layer strategy to safeguard the availability, confidentiality, and integrity of consumer information. It provides the industry's most cutting-edge big data financial governance. It has a vast list of features such as - Construction of machine learning models, Faster Data Scientific model development, deployment, and iteration can be accelerated by: Trial Monitoring, Front end tool integrations out of the box include RStudio, H2O.ai, and Data robot, Schedulers and Airflow-anchored End-to-End Workflows, Managed Notebooks - Offline (Serverless) Editing. One of its most beneficial features is Automated Infrastructure Provisioning - automatically reduce costs while accommodating an increase in concurrent users without affecting performance. No matter how many users or model versions there are, the management overhead should be almost nil. Automatically scale up or down to accommodate all workloads at any given time. Ecosystem partners like Rstudio, Google Cloud, Amazon SageMaker. Read more |
| Pricing Options |
|
|
| SW Score & Breakdown |
89% SW Score The SW Score ranks the products within a particular category on a variety of parameters, to provide a definite ranking system. Read more
|
86% SW Score The SW Score ranks the products within a particular category on a variety of parameters, to provide a definite ranking system. Read more
|
| SaaSworthy Awards | # 17 Highly Rated |
Not Available
|
| Total Features |
9 Features
|
5 Features
|
| Common Features for All |
Ad hoc Analysis
Ad hoc Query
Ad hoc Reports
Benchmarking
Dashboard
Data Analysis
Key Performance Indicators
Strategic Planning
Trend Indicators
|
Ad hoc Analysis
Ad hoc Query
Ad hoc Reports
Benchmarking
Dashboard
Data Analysis
Key Performance Indicators
Strategic Planning
Trend Indicators
|
| Organization Types Supported |
|
|
| Platforms Supported |
|
|
| Modes of Support |
|
|
| API Support |
|
| User Rating |
|
|
| Rating Distribution |
|
|
| User Sentiments |
Intuitive User Interface, Data Visualization Capabilities, Extensive Data Source Connectivity, Powerful Data Handling Steep Learning Curve, Outdated User Interface, Limited Self-Service Functionality, Performance Issues with Large Datasets |
Easy to Use Interface, Extensive Big Data Tool Integration, Fast Data Processing, Excellent Customer Support Unstable Notebook Functionality, Occasional Slow Performance, Lack of Advanced Visualization Tools, Occasional Software Bugs |
| Review Summary |
The consensus among reviewers is that QlikView is a robust and flexible business intelligence and data visualization tool that enables users to create interactive dashboards and reports from various data sources. It is praised for its ease of use, drag-and-drop functionality, and ability to handle large datasets. However, some users have mentioned that the software can be expensive and may require a steep learning curve for advanced features. Additionally, some reviewers have reported occasional issues with data connectivity and performance. Overall, QlikView is considered a powerful tool for data analysis and visualization, but it may not be the most cost-effective option for small businesses or users with limited technical expertise. |
Qubole garners positive feedback for its user-friendly interface, ease of use, and the ability to efficiently handle large datasets. Users appreciate its scalability, flexibility, and support for various data sources and formats. The platform's data processing capabilities and machine learning integration are also praised. However, some reviewers express concerns regarding its pricing and occasional performance issues. Additionally, the need for technical expertise for certain tasks and the complexity of some features are mentioned as areas for improvement. |
| Read All User Reviews | Read All User Reviews |
AI-Generated from the text of User Reviews
| Pricing Options |
|
|
|
Pricing Plans
Monthly Plans
Annual Plans
|
QlikView Custom |
Free Test Drive Free Qubole Data Platform - Enterprise Edition $0.14 $0.14 |
|
View Detailed Pricing
|
View Detailed Pricing
|
Get personalized recommendations from our experts on call
Trusted by more than 5 Million users across the globe.
Thank you for the enquiry. One of our software analysts will contact you soon.
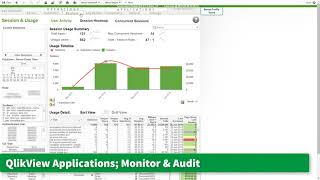
| Screenshots |

|

+ 1 More
|
| Videos |
+ 1 More
|

+ 3 More
|
| Company Details | Located in: King of Prussia, Pennsylvania | Founded in: 2011 |
| Contact Details |
+1 (866) 616-4960 |
Not available |
| Social Media Handles |
|
|
Looking for the right SaaS
We can help you choose the best SaaS for your specific requirements. Our in-house experts will assist you with their hand-picked recommendations.
Want more customers?
Our experts will research about your product and list it on SaaSworthy for FREE.


