Sisense |
91% SW Score The SW Score ranks the products within a particular category on a variety of parameters, to provide a definite ranking system. Read more
Start Free Trial
|
91% SW Score The SW Score ranks the products within a particular category on a variety of parameters, to provide a definite ranking system. Read more
Start Free Trial
|
Sponsored
85% SW Score The SW Score ranks the products within a particular category on a variety of parameters, to provide a definite ranking system. Read more ManageEngine Analytics Plus
Visit Website
|
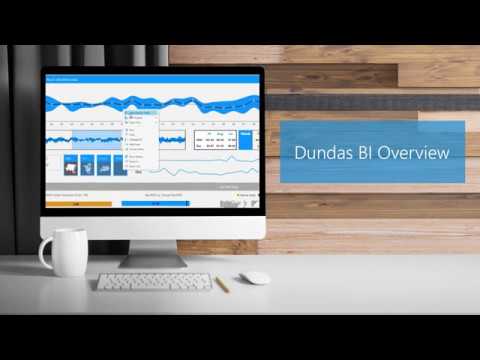
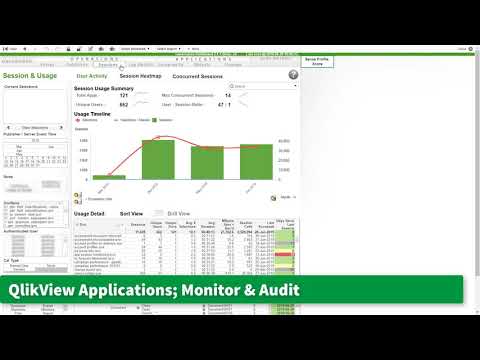
| Description | Dundas BI is a platform that provides its users with enterprise-level business intelligence, dashboard software, and data analytics, which empowers users to analyze and visualize any data to make real-time data-driven results. The software provides its users with Smart design Experience along with a large number of layouts and visualizations options to choose from. One can create pixel-perfect dashboards to help users gain valuable insight and make decisions faster. Users can quickly analyze their data in a meaningful way while exploring the available data and incorporate their own data file through an intuitive drag and drop functionality. The agile data flow offered by the software enables users to begin their data journey in accordance to their preferences. Users can re-use and share any content that they created across the entire organization. The HTML interface allows users to deploy on all mobile devices without requiring to build and maintain specific solutions for each of them. Read more | QlikView is a powerful BI platform that provides its users with an analytics solution for developing highly interactive guided analytics applications and dashboards. These are designed to deliver insight to solve various business challenges. The software allows its users to move data at scale in real-time without tasking source systems and efficiently providing data to the cloud and beyond. Users can automate the process from raw to analytics-ready data by getting agility and scale, automating your data warehouse, or data lake. One can eliminate complex scripting, build trust, and reduce errors. QlikView allows its users to make data easily accessible with enterprise data catalog by delivering trusted, governed access to all the correct data with an easy way for users to find, prepare, and use actionable data. Users can explore without boundaries as the Associative Engine indexes every relationship in the data of the users. The powerful AI offered by the software accelerates discoveries and raises data literacy, automates processes, and surfaces contextual insights. Read more | Make your data more useful than ever before with advanced analytics and feature-rich dashboards from ManageEngine Analytics Plus. You can connect to any data source and upload files, spreadsheets, URL feeds and a lot more with absolute ease. Build complex reports on its easy-to-use interface and represent your data on a variety of charts, widgets and tabular views. You can also combine multiple reports and view it on a single dashboard and use its powerful formula engine to derive metrics from complex data and reports. Integrate with ManageEngine’s ITSM, support and IT support suite and get a better insight into your helpdesk and customer support operations. Read more |
| Pricing Options |
|
|
|
| SW Score & Breakdown |
91% SW Score The SW Score ranks the products within a particular category on a variety of parameters, to provide a definite ranking system. Read more
|
91% SW Score The SW Score ranks the products within a particular category on a variety of parameters, to provide a definite ranking system. Read more
|
85% SW Score The SW Score ranks the products within a particular category on a variety of parameters, to provide a definite ranking system. Read more
|
| SaaSworthy Awards | # 15 Highly Rated | # 17 Highly Rated |
Not Available
|
| Total Features |
10 Features
|
9 Features
|
7 Features
|
| Common Features for All |
Ad hoc Analysis
Ad hoc Query
Ad hoc Reports
Benchmarking
Dashboard
Data Analysis
Key Performance Indicators
Profitability Analysis
Strategic Planning
Trend Indicators
|
Ad hoc Analysis
Ad hoc Query
Ad hoc Reports
Benchmarking
Dashboard
Data Analysis
Key Performance Indicators
Profitability Analysis
Strategic Planning
Trend Indicators
|
Ad hoc Analysis
Ad hoc Query
Ad hoc Reports
Benchmarking
Dashboard
Data Analysis
Key Performance Indicators
Profitability Analysis
Strategic Planning
Trend Indicators
|
| Organization Types Supported |
|
|
|
| Platforms Supported |
|
|
|
| Modes of Support |
|
|
|
| API Support |
|
|
|
| User Rating |
|
|
|
| Rating Distribution |
|
|
|
| User Sentiments |
Highly Customizable, Excellent Customer Support, Intuitive User Interface, Extensive Integrations Steep Learning Curve, Slow Performance with Large Datasets, Limited Data Filtering Options, Occasional Bugs and Glitches |
Intuitive User Interface, Data Visualization Capabilities, Extensive Data Source Connectivity, Powerful Data Handling Steep Learning Curve, Outdated User Interface, Limited Self-Service Functionality, Performance Issues with Large Datasets |
Not Available
|
| Review Summary |
Dundas BI garners praise for its user-friendly interface, customizable dashboards, and robust reporting capabilities. Reviewers appreciate the ease of creating interactive and visually appealing dashboards, even for non-technical users. The drag-and-drop functionality and pre-built templates simplify report creation, and the ability to drill down into data provides deeper insights. Additionally, Dundas BI's customer support is lauded for its responsiveness and helpfulness. While some users mention occasional performance issues or a learning curve for advanced features, overall, reviewers find Dundas BI a valuable tool for data analysis and visualization. |
The consensus among reviewers is that QlikView is a robust and flexible business intelligence and data visualization tool that enables users to create interactive dashboards and reports from various data sources. It is praised for its ease of use, drag-and-drop functionality, and ability to handle large datasets. However, some users have mentioned that the software can be expensive and may require a steep learning curve for advanced features. Additionally, some reviewers have reported occasional issues with data connectivity and performance. Overall, QlikView is considered a powerful tool for data analysis and visualization, but it may not be the most cost-effective option for small businesses or users with limited technical expertise. |
Not Available
|
| Read All User Reviews | Read All User Reviews | Read All User Reviews |
AI-Generated from the text of User Reviews
| Pricing Options |
|
|
|
|
Pricing Plans
Monthly Plans
Annual Plans
|
Dundas BI Custom |
QlikView Custom |
Personal edition Free Professional edition Perpetual $5,995.00 $5,995.00 One time payment Professional edition Annual Subscription $2,395.00 $2,395.00 per year |
|
View Detailed Pricing
|
View Detailed Pricing
|
View Detailed Pricing
|
|
|
|
||
| Screenshots |

+ 3 More
|

|
Not Available |
| Videos |
+ 3 More
|
+ 1 More
|

|
| Company Details | Located in: Ontario, Canada Founded in: 1992 | Located in: King of Prussia, Pennsylvania | Located in: Pleasanton, USA |
| Contact Details |
+1-800-463-1492 https://www.dundas.com/dundas-bi |
+1 (866) 616-4960 https://www.qlik.com/us/products/qlikview |
+1-925-924-9500 https://www.manageengine.com/analytics-plus/ |
| Social Media Handles |
|
|
|
Looking for the right SaaS
We can help you choose the best SaaS for your specific requirements. Our in-house experts will assist you with their hand-picked recommendations.
Want more customers?
Our experts will research about your product and list it on SaaSworthy for FREE.


