This product profile is currently unclaimed.
The listing is published on SaaSworthy, but the official vendor does not yet manage it. Are you part of the Vizzlo team? Claim this profile to manage and update your product information.
Vizzlo is a reliable data visualization platform that offers variable visualization choices.You can frame professional-grade charts and complex business graphics with this tool, within shortest time period possible.It is possible to enter necessary data by importing spreadsheets from Google Documents, Excel, or using the company’s API at ease. With this software, you can share your presentation across all your social media channels.The software provides custom made graphics to add value to your presentation.Just drag-n-drop the visual graphics you designed to Keynote or PowerPoint impress your clients with a stunning presentation. Vizzlo facilitates enhancing project management also.
Read more

Pricing
SW Score Breakdown
Platforms Supported
Organization Types Supported
API Support
Modes of Support
Video
Helps to incorporate or to embed videos in the presentationOffline Presenting
Helps doing offline presentationOffline Editing
Helps to make changes and to edit the presentation content or data in an offline modeTemplates
Templates are patterns that help to provide the layout to build and design a website quickly.Animation
Helps doing motion design and animate the transitions for making UI elements livelyZoom (Pan)
Helps changing the angle of view or allows enlarging a certain portion of the displayed data for better and prominent viewContent Library
It is a catalog of resources that serves as a lead generating toolAudio
Facilitates incorporating audio or sound elements into the presentation video.3D
Helps to add an illusion of depth or three-dimension perception to enhance the presentation video qualityFree Trial
Available
Free Free
Features
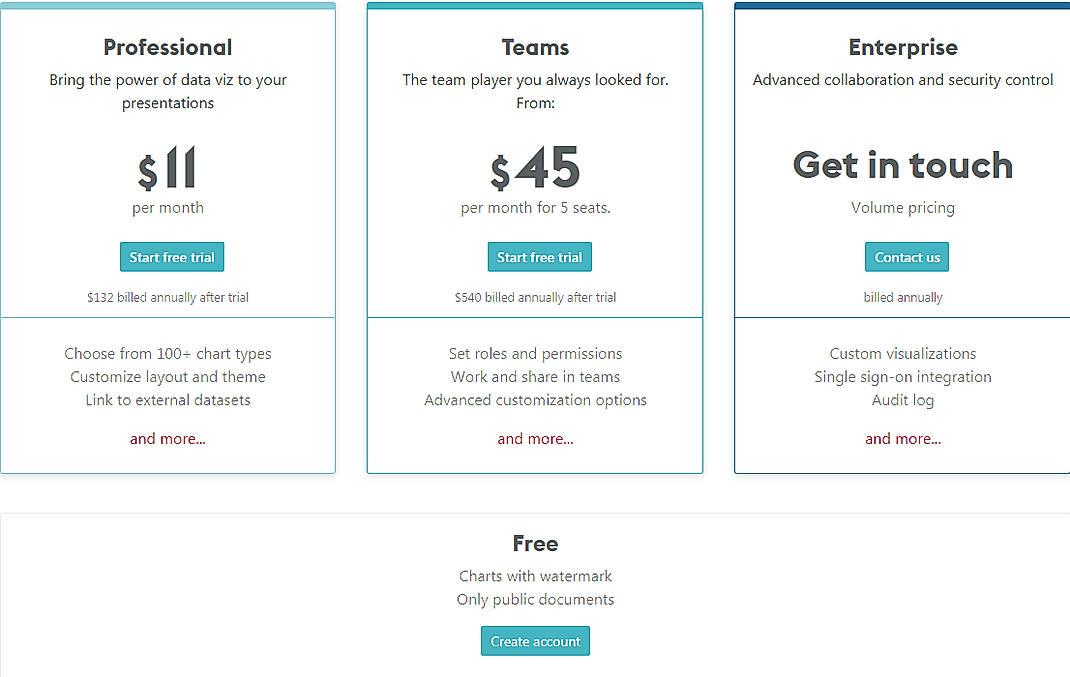
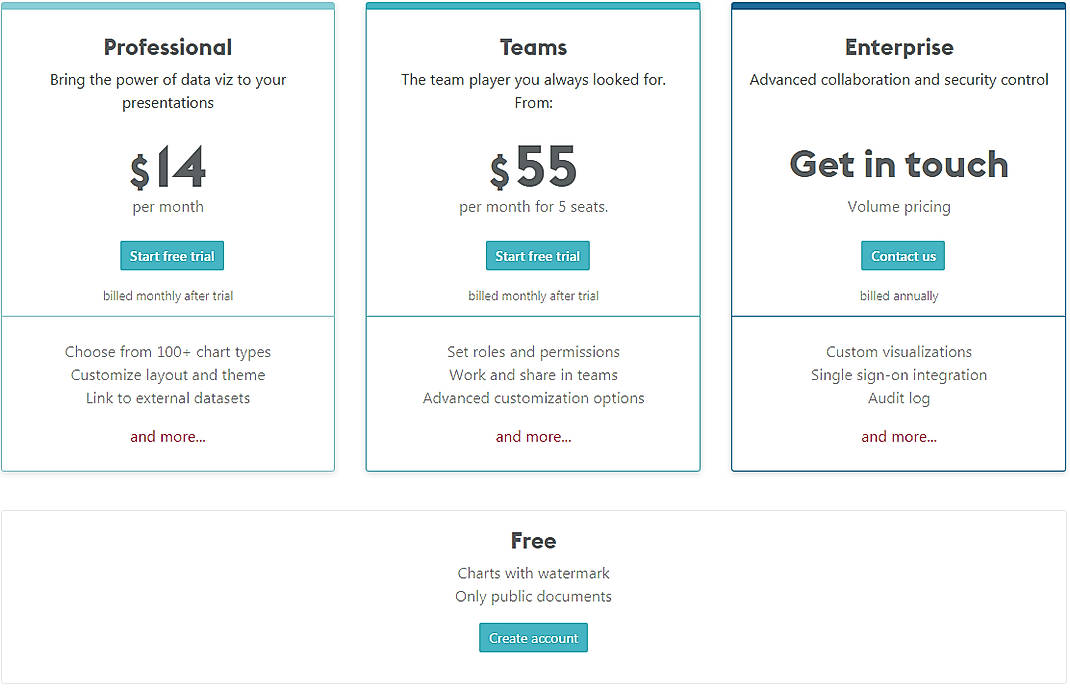
Professional $11.00 $14.00 per month
Features
Teams $45.00 $55.00 per month
Billed for 5 seats
Features
Enterprise Custom
Features
Screenshots of Vendor Pricing Page
Disclaimer: The pricing details were last updated on 22/06/2018 from the vendor website and may be different from actual. Please confirm with the vendor website before purchasing.
Learn more about Vizzlo Pricing
78% SW Score The SW Score ranks the products within a particular category on a variety of parameters, to provide a definite ranking system. Read more
98% SW Score The SW Score ranks the products within a particular category on a variety of parameters, to provide a definite ranking system. Read more
85% SW Score The SW Score ranks the products within a particular category on a variety of parameters, to provide a definite ranking system. Read more
96% SW Score The SW Score ranks the products within a particular category on a variety of parameters, to provide a definite ranking system. Read more
97% SW Score The SW Score ranks the products within a particular category on a variety of parameters, to provide a definite ranking system. Read more
91% SW Score The SW Score ranks the products within a particular category on a variety of parameters, to provide a definite ranking system. Read more
Vizzlo for Google...

Dashboard

Home
What is Vizzlo used for?
Vizzlo is Presentation Software. Vizzlo offers the following functionalities:
Learn more about Vizzlo features.
What are the top alternatives for Vizzlo?
Here`s a list of the best alternatives for Vizzlo:
Does Vizzlo provide API?
Yes, Vizzlo provides API.
Vendor Details
Leipzig, Germany Founded : 2015Social Media Handles
This research is curated from diverse authoritative sources; feel free to share your feedback at [email protected]
Looking for the right SaaS
We can help you choose the best SaaS for your specific requirements. Our in-house experts will assist you with their hand-picked recommendations.
Want more customers?
Our experts will research about your product and list it on SaaSworthy for FREE.