Microsoft Power BI |
93% SW Score The SW Score ranks the products within a particular category on a variety of parameters, to provide a definite ranking system. Read more
Start Free Trial
|
92% SW Score The SW Score ranks the products within a particular category on a variety of parameters, to provide a definite ranking system. Read more
Start Free Trial
|
Sponsored
84% SW Score The SW Score ranks the products within a particular category on a variety of parameters, to provide a definite ranking system. Read more ManageEngine Analytics Plus
Visit Website
|
| Description | Tableau is an integrated business intelligence and visual analytics solution that helps users analyse the key business data and find solutions to different problems. The platform can be used to obtain data from multiple sources, such as spreadsheets, databases, SQL and cloud apps, to generate meaningful insights. It helps users generate interactive maps and find necessary solutions to all their problems – whether they are analysts, students, teachers, executives or business owners. From connection to collaboration, the platform provides a secure, powerful and flexible end-to-end analytical approach, finding out AI-driven effective solutions. Tableau is capable to scale companies engaged in different industries, including manufacturing, communication, healthcare, education, technology and real estate. It is referred to as the world’s deepest and broadest analytics platform, compatible with Salesforce CRM. Other than English its is available in different global languages like Spanish, German, Italian, Portuguese and more. Read more | ClicData is a business intelligence software that enables you to connect data from more than 250 sources into one data warehouse and build attractive, interactive dashboards that can be shared instantly. It allows you to connect, automate, prep, and visualise your data and make Business Intelligence easier to use and employ for all sorts of companies. With ClickData’s agile and creative technology, data-driven teams can simply manage any form of data and firmly tie it to the visualisation. This enables for smarter and quicker visualisation while keeping the data warehouse as the sole source of information. You can prepare your data refreshes and automate them and using their ETL capabilities, you can clean, join, merge, combine, and aggregate data. It further enables you to create dynamic and automated dashboards to visualise your KPIs. Users can collaborate and share on dynamic and live dashboards with their team or customers through links, exports, or emails. ClicData provides you with all of the tools you need to become self-sufficient and have your dashboards up and operating in as little as a day. Read more | Make your data more useful than ever before with advanced analytics and feature-rich dashboards from ManageEngine Analytics Plus. You can connect to any data source and upload files, spreadsheets, URL feeds and a lot more with absolute ease. Build complex reports on its easy-to-use interface and represent your data on a variety of charts, widgets and tabular views. You can also combine multiple reports and view it on a single dashboard and use its powerful formula engine to derive metrics from complex data and reports. Integrate with ManageEngine’s ITSM, support and IT support suite and get a better insight into your helpdesk and customer support operations. Read more |
| Pricing Options |
|
|
|
| SW Score & Breakdown |
93% SW Score The SW Score ranks the products within a particular category on a variety of parameters, to provide a definite ranking system. Read more
|
92% SW Score The SW Score ranks the products within a particular category on a variety of parameters, to provide a definite ranking system. Read more
|
84% SW Score The SW Score ranks the products within a particular category on a variety of parameters, to provide a definite ranking system. Read more
|
| SaaSworthy Awards | # 1 Most Worthy # 4 Highly Rated | # 20 Highly Rated # 14 Fastest Growing |
Not Available
|
| Total Features |
10 Features
|
10 Features
|
7 Features
|
| Common Features for All |
Ad hoc Analysis
Ad hoc Query
Ad hoc Reports
Benchmarking
Dashboard
Data Analysis
Key Performance Indicators
Profitability Analysis
Strategic Planning
Trend Indicators
|
Ad hoc Analysis
Ad hoc Query
Ad hoc Reports
Benchmarking
Dashboard
Data Analysis
Key Performance Indicators
Profitability Analysis
Strategic Planning
Trend Indicators
|
Ad hoc Analysis
Ad hoc Query
Ad hoc Reports
Benchmarking
Dashboard
Data Analysis
Key Performance Indicators
Profitability Analysis
Strategic Planning
Trend Indicators
|
| Organization Types Supported |
|
|
|
| Platforms Supported |
|
|
|
| Modes of Support |
|
|
|
| API Support |
|
|
|
| User Rating |
|
|
|
| Rating Distribution |
|
|
|
| User Sentiments |
Intuitive User Interface, Extensive Data Visualization Capabilities, Extensive Data Source Integrations, Active User Community Frequent Software Updates, Performance Issues with Large Datasets, Limited ETL Capabilities, High Pricing |
Not Available
|
Not Available
|
| Review Summary |
Tableau is lauded for its user-friendly interface, enabling even non-technical users to create insightful visualizations and reports. Its drag-and-drop functionality and intuitive design streamline data analysis, making it accessible to users of all skill levels. Additionally, Tableau's wide range of data connectors and integrations with various data sources enhances its versatility and allows users to seamlessly incorporate data from multiple platforms. The platform's collaborative features, such as the ability to share dashboards and collaborate on projects, further enhance its appeal for teams seeking a collaborative data analysis solution. |
Not Available
|
Not Available
|
| Read All User Reviews | Read All User Reviews | Read All User Reviews |
AI-Generated from the text of User Reviews
| Pricing Options |
|
|
|
|
Pricing Plans
Monthly Plans
Annual Plans
|
Tableau Creator (For Individuals) $70.00 $70.00 per user / month Tableau Explorer (On-Premise or Public Cloud) $35.00 $35.00 per user / month Tableau Viewer (On-Premise or Public Cloud) $12.00 $12.00 per user / month Tableau Creator (Fully Hosted) $70.00 $70.00 per user / month Tableau Explorer (Fully Hosted) $42.00 $42.00 per user / month Tableau Viewer (Fully Hosted) $15.00 $15.00 per user / month Embedded Analytics Custom |
Premium $71.00 $79.00 per month Team $238.00 $269.00 per month Enterprise $450.00 $525.00 per month Dedicated Custom |
Personal edition Free Professional edition Perpetual $5,995.00 $5,995.00 One time payment Professional edition Annual Subscription $2,395.00 $2,395.00 per year |
|
View Detailed Pricing
|
View Detailed Pricing
|
View Detailed Pricing
|
|
|
|
||
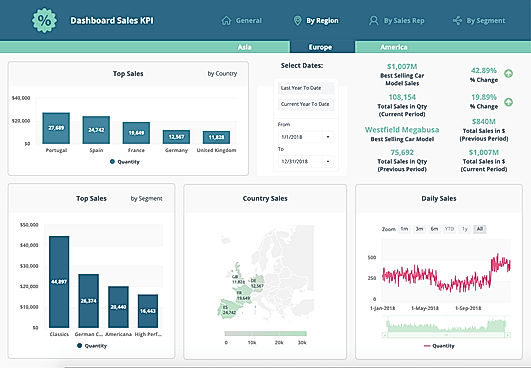
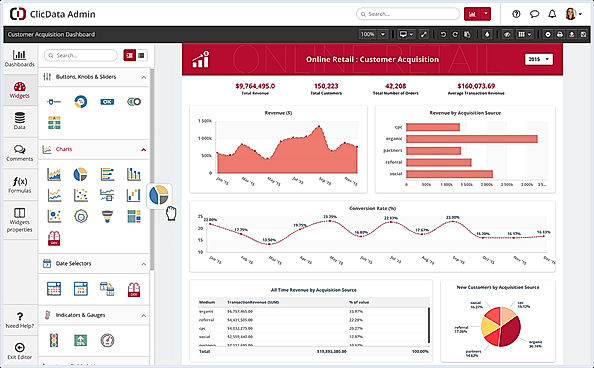
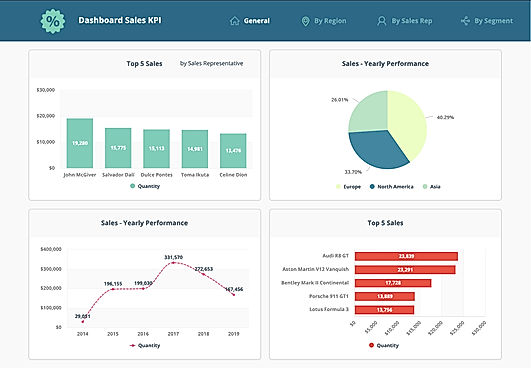
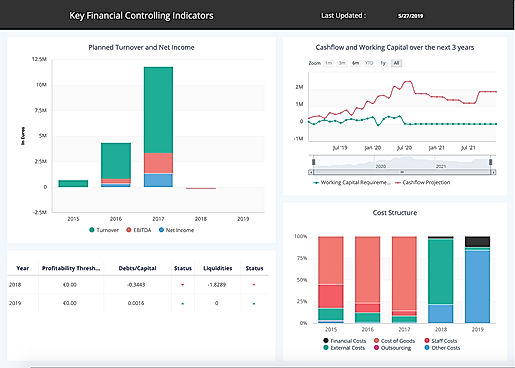
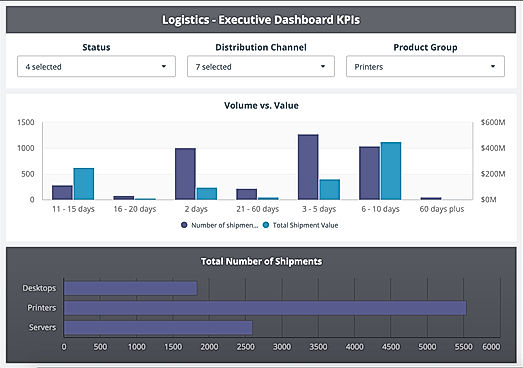
| Screenshots |

+ 3 More
|
+ 4 More
|
Not Available |
| Videos |

+ 2 More
|

+ 3 More
|

|
| Company Details | Located in: Seattle, Washington Founded in: 2003 | Located in: Guilbert, Arizona Founded in: 2008 | Located in: Pleasanton, USA |
| Contact Details |
+1 206-633-3400 https://www.tableau.com/ |
+1 888-404-2542 https://www.clicdata.com/ |
+1-925-924-9500 https://www.manageengine.com/analytics-plus/ |
| Social Media Handles |
|
|
|
Looking for the right SaaS
We can help you choose the best SaaS for your specific requirements. Our in-house experts will assist you with their hand-picked recommendations.
Want more customers?
Our experts will research about your product and list it on SaaSworthy for FREE.