Alteryx |
83% SW Score The SW Score ranks the products within a particular category on a variety of parameters, to provide a definite ranking system. Read more
Start Free Trial
|
76% SW Score The SW Score ranks the products within a particular category on a variety of parameters, to provide a definite ranking system. Read more
Start Free Trial
|
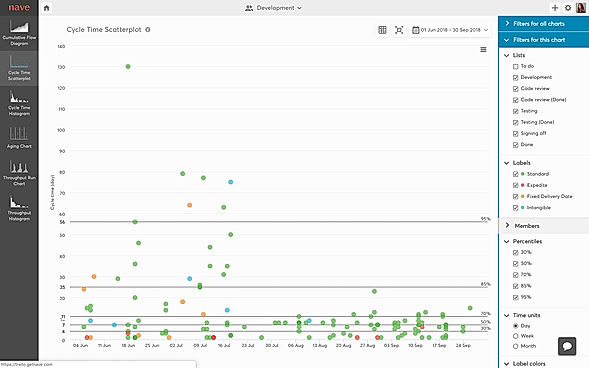
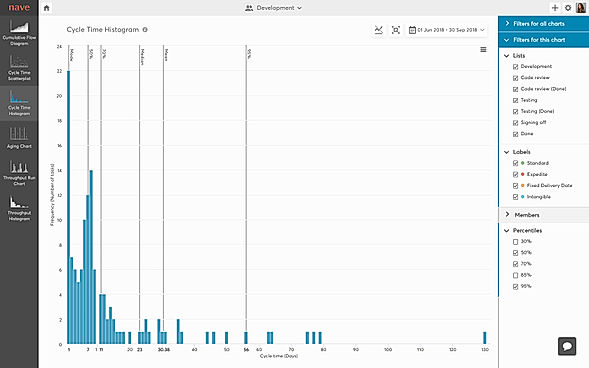
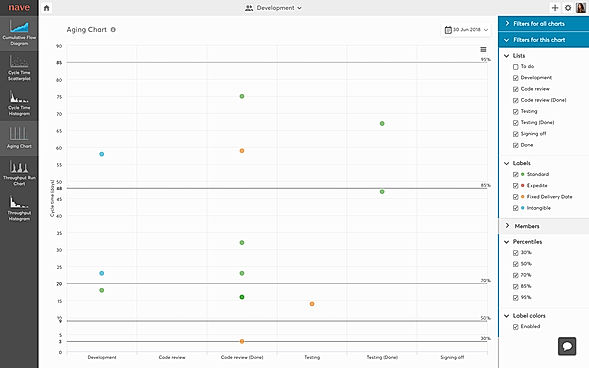
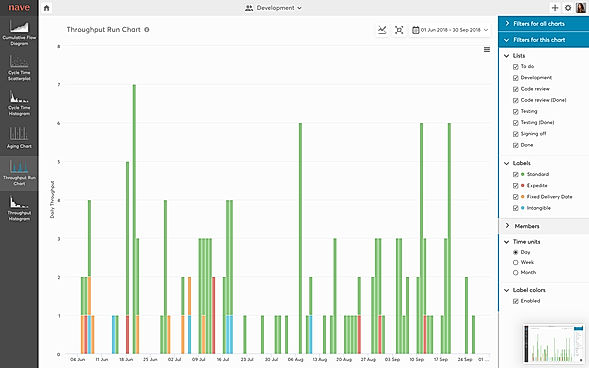
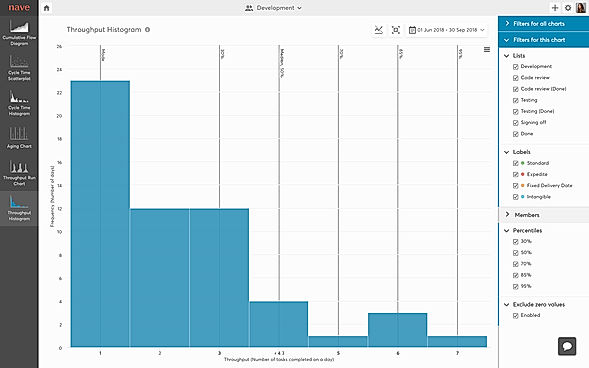
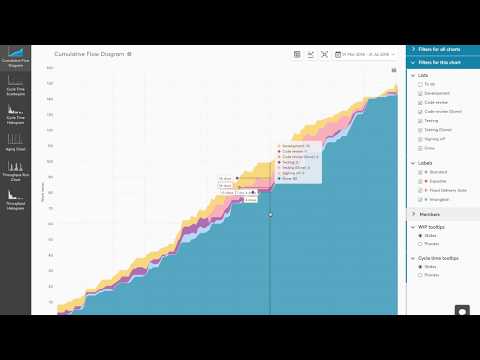
| Description | Nave is an advanced dashboard monitoring software that helps businesses to focus on improving workflow efficiency levels by easily identifying essential problems. With the dashboards, users can find the fundamental characteristics of a Kanban process. The industry-standard analytical charts for Kanban present within, help businesses improve their prospects in real-time. Further, seamless integration with external platforms like Jira Software, Trello, Azure DevOps etc is also of great help. Nave enables users to evaluate the efficiency levels of different processes besides helping teams to identify problem areas with a cumulative flow diagram. The cycle time scatterplot present within the same tracks the overall time required for completing a particular project, whereas the breakdown chart reveals the most time-consuming processes. Inbuilt cycle time histogram lets businesses analyse effective cycle time trends, whereas the ageing chart, helps with current task monitoring purposes. Additional features like throughput run chart and throughput histogram are also of great help. Read more | SheetChart is a smart reporting tool designed for businesses to track and manage their businesses metrics and performance. It comes with dashboards that integrate with Google Sheets and saves time when tracking the company’s performance. Businesses can drive better decisions by exploring company data and make informed decisions whenever needed. It allows users to measure the performance of the important KPIs and compare current performance against past values. To support the decision-making process, users can identify underlying trends and past business performance. Businesses can visualize the contribution to each of their KPIs by transaction source and get a better understanding of cash flows. Users can identify issues by monitoring churn values and quantify the impact of marketing activities based on customer activities. It comes with custom projections where users can just select the forecasting window, aggregation interval and project revenue, expenses, or customer number. Business users can also compare forecasts against past performance and identify issues and opportunities. This helps with early detection and avoiding major mistakes in business decisions. Read more |
| Pricing Options |
|
|
| SW Score & Breakdown |
83% SW Score The SW Score ranks the products within a particular category on a variety of parameters, to provide a definite ranking system. Read more
|
76% SW Score The SW Score ranks the products within a particular category on a variety of parameters, to provide a definite ranking system. Read more
|
| Total Features |
7 Features
|
6 Features
|
| Common Features for All |
Data Integration
Data Security
Interactive Dashboard
Key Performance Indicators
OLAP
Private Dashboard
Public Dashboard
Visual Analytics
Widgets
|
Data Integration
Data Security
Interactive Dashboard
Key Performance Indicators
OLAP
Private Dashboard
Public Dashboard
Visual Analytics
Widgets
|
| Organization Types Supported |
|
|
| Platforms Supported |
|
|
| Modes of Support |
|
|
| API Support |
|
|
| Read All User Reviews | Read All User Reviews |
AI-Generated from the text of User Reviews
| Pricing Options |
|
|
|
Pricing Plans
Monthly Plans
Annual Plans
|
Jet Ski $31.00 $39.00 per user / month Speedboat $47.00 $59.00 per month Yacht $79.00 $99.00 per month Cruise Ship $127.00 $159.00 per month |
Basic $19.00 $29.00 per month Custom Custom |
|
View Detailed Pricing
|
View Detailed Pricing
|
|
Kanban One
4.6 Based on 10 Ratings
KanbanFlow
4.5 Based on 91 Ratings
Kanban Tool
4.8 Based on 120 Ratings
Screenful
4.6 Based on 88 Ratings |
BrightGauge
4.7 Based on 59 Ratings
Klipfolio Dashboard
4.7 Based on 933 Ratings |
|
| Screenshots |
+ 4 More
|

+ 2 More
|
| Videos |
+ 1 More
|
Not Available |
| Company Details | Located in: Antwerp, Belgium Founded in: 2014 |
Not available |
| Contact Details |
+32 470 998915 https://getnave.com/ |
Not available https://www.sheetchart.com/ |
| Social Media Handles |
|
Not available |
Looking for the right SaaS
We can help you choose the best SaaS for your specific requirements. Our in-house experts will assist you with their hand-picked recommendations.
Want more customers?
Our experts will research about your product and list it on SaaSworthy for FREE.