|
94% SW Score The SW Score ranks the products within a particular category on a variety of parameters, to provide a definite ranking system. Read more
View Details
|
79% SW Score The SW Score ranks the products within a particular category on a variety of parameters, to provide a definite ranking system. Read more
View Details
|
96% SW Score The SW Score ranks the products within a particular category on a variety of parameters, to provide a definite ranking system. Read more
View Details
|
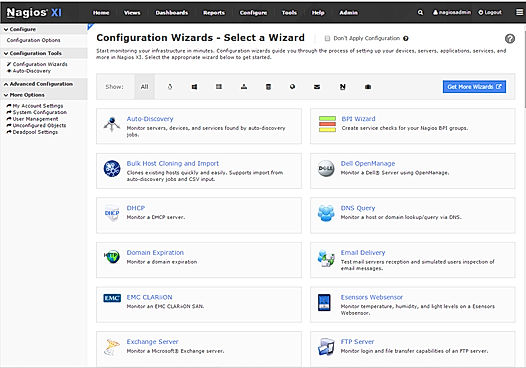
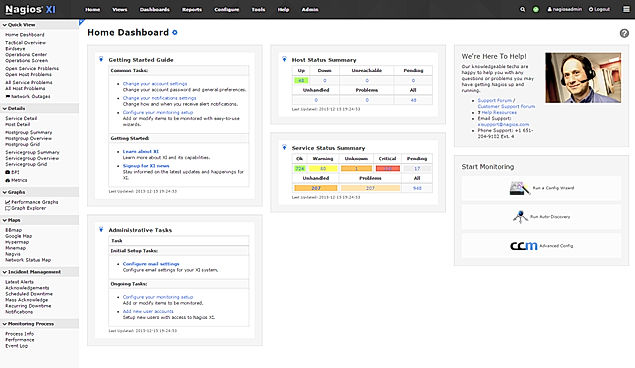
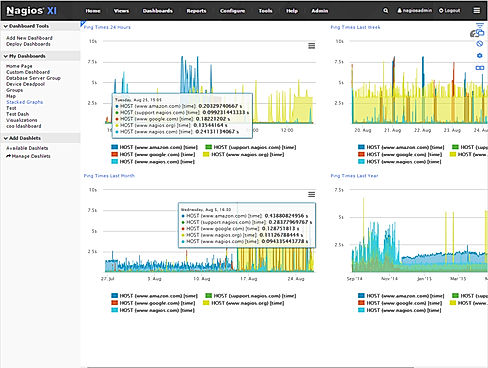
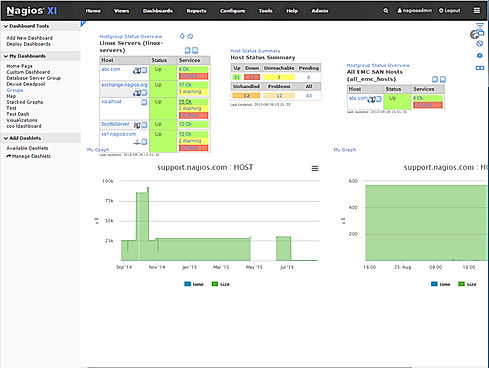
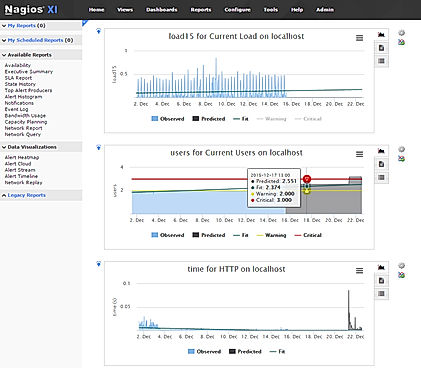
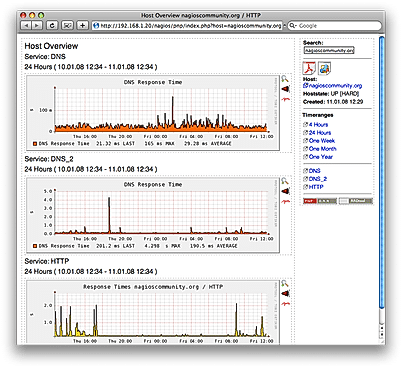
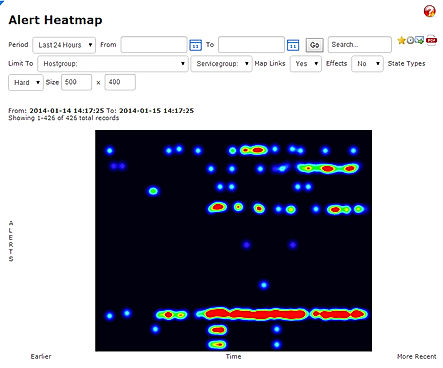
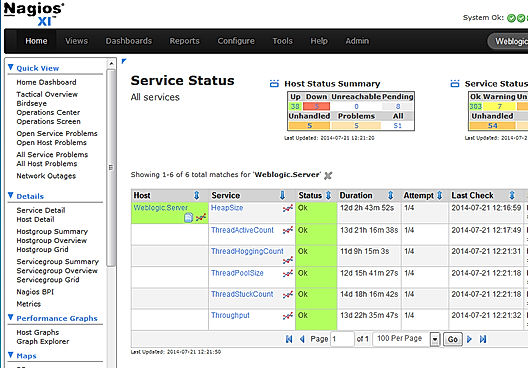
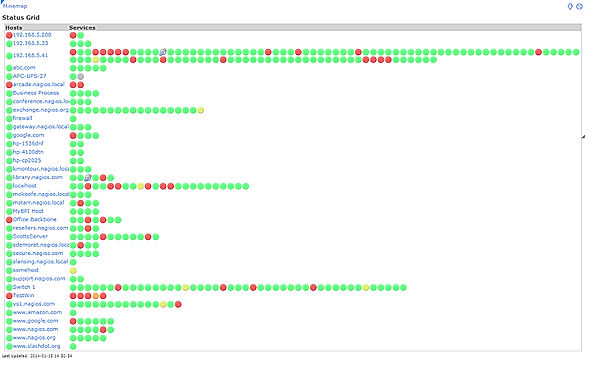
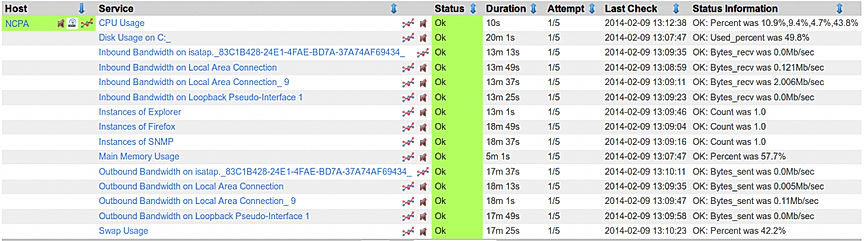
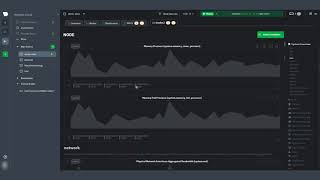
| Description | Nagios XI is claimed to be the most trusted open source network monitoring software available in the market.The software truly comes equipped with a myriad of network monitoring features that include resource management, server monitoring, SLA monitoring, uptime monitoring, internet usage monitoring, bandwidth monitoring IP address monitoring and offers web traffic reporting etc.It also offers baseline manager, real time analytics and diagnostic tools.You can smartly and easily monitor all your network equipment such as routers, switches, servers etc.Tracking traffic on the network at anytime also becomes easier.It comes with an intuitive interface and is customizable too. Read more | Netdata is a Linux-based software that helps to diagnose anomalies and slowdowns in your system with insightful analysis, metrics and engaging visualizations. Get a live demo of your system’s performance from various cities in the world. It covers an array of fields where data is provided like RAM, CPU, IP Address, network performance across various bandwidths, softnets, entropy, and disks. It enables you to see monitoring, Nginx, IP Networking and even monitors net data along with programming in MySQL. Netdata can be installed on any platform and detects hundreds of metrics in real-time through fully functional visualizations. It can monitor your health in real-time and moreover it is flexible and easy to integrate with hundreds of metrics. This app allows users to detect low-latency visualizations to detect any possible anomalies after comparison with metrics. The dedicated database of Netdata doesn't require resources to detect. It just collects, stores and processes data to let you visualize in low-latency and high-power resolutions followed by streaming of data and final archive. Read more | Grafana is software that assists companies to monitor everything from Prometheus & Graphite metrics, logs, applications, beehives, power plants, sourdough starters, and custom data sources. It makes metric visualization tools that are more accessible and easy to use across the entire company. Grafana cloud plan collects, analyzes, and alerts users on Graphite and Prometheus metrics and Loki logs on highly available, high-performance, and fully managed Grafana Cloud platforms. Users can get visibility into all data sources and metrics across their teams without jumping through multiple tabs and tools. The platform enables users to get massive query performance and high efficiency for their Prometheus metrics at any scale. Users can also access Grafana Enterprise, which includes access to enterprise plugins that take users' existing data sources and allow them to drop them right into Grafana. This will enable users to get the best out of their complicated and expensive monitoring solutions and databases by visualizing all the data more easily and effectively. Read more | Prometheus is a metrics-based monitoring system that is designed to track an organisation's overall health, performance and behaviour. It gathers, organises and stores real-time metrics besides delivering intuitive alerts in no time. The software uses dimensional data modelling, flexible query language, modern alerting techniques and an effective time-series database to provide elegant monitoring solutions. With a cleverly designed interface and futuristic features, Prometheus delivers excellent insights derived from a variety of metrics. By implementing a highly dimensional data tool and key-value pairs, it converts data into meaningful insights. This efficient monitoring solution enables users to slice and dice collected time series data through PromQL and generate informative graphs, tables, and alerts as per convenience. Prometheus also comes loaded with a variety of sophisticated templates facilitating seamless data visualisation and integrated Grafana functionality. Furthermore, it provides an efficient storage facility for time series besides working on a simple yet reliable server. The platform’s alerting approach is rooted in PromQL and is flexibly designed. Lastly, this open-source software is completely community-driven and highly secure as well. Read more |
| Pricing Options |
|
|
|
|
| SW Score & Breakdown |
94% SW Score The SW Score ranks the products within a particular category on a variety of parameters, to provide a definite ranking system. Read more
|
79% SW Score The SW Score ranks the products within a particular category on a variety of parameters, to provide a definite ranking system. Read more
|
96% SW Score The SW Score ranks the products within a particular category on a variety of parameters, to provide a definite ranking system. Read more
|
|
| SaaSworthy Awards |
Not Available
|
Not Available
|
# 5 Fastest Growing # 2 Most Popular |
Not Available
|
| Organization Types Supported |
|
|
|
|
| Platforms Supported |
|
|
|
|
| Modes of Support |
|
|
|
|
| API Support |
|
|
|
|
| User Rating |
|
Not Available
|
|
|
| Rating Distribution |
|
Not Available
|
|
|
| User Sentiments |
Not Available
|
Not Available
|
Easy to Use Interface, Extensive Customization Options, Powerful Visualization Capabilities, Wide Range of Data Source Integrations Steep Learning Curve, Slow Loading Times, Limited Alerting Functionality, Complex Querying Language |
Easy to Install and Configure, Extensive Integrations, Customizable Metrics, Efficient Monitoring Complex Query Language (PromQL), Limited Built-in Visualization, Steep Learning Curve, Lack of Detailed Documentation |
| Review Summary |
Not Available
|
Not Available
|
Grafana is widely praised for its powerful visualization capabilities, allowing users to create custom dashboards that provide insightful views of data from a variety of sources. Users appreciate its flexibility, extensive plugin library, and ease of integration with various monitoring tools. However, some users find the initial setup and configuration process complex, and point to limitations in its alerting capabilities. Despite these drawbacks, Grafana remains a popular choice for monitoring and analysis, particularly for those seeking a customizable open-source solution. |
Users praise Prometheus for its robust monitoring capabilities, highlighting its user-friendly interface, extensive metrics library, and flexible alerting system. They appreciate its ability to collect and visualize data from diverse sources, enabling comprehensive monitoring of IT infrastructure and applications. Additionally, users commend Prometheus's open-source nature, strong community support, and active development, ensuring continuous improvements and feature enhancements. While some users mention occasional performance issues or a learning curve for new users, the overall sentiment is overwhelmingly positive, reflecting Prometheus's effectiveness as a monitoring solution. |
| Read All User Reviews | Read All User Reviews | Read All User Reviews |
AI-Generated from the text of User Reviews
| Pricing Options |
|
|
|
|
|
Pricing Plans
Monthly Plans
Annual Plans
|
Free Free Standard Others Enterprise Others Sitewide Custom |
Agent OSS Free Community Free Pro $3.00 $3.00 per month Business $4.00 $4.00 per month Enterprise Custom |
Free Forever Free Pro $19.00 $19.00 per month Advanced $299.00 $299.00 per month Enterprise Custom |
Prometheus Custom |
|
View Detailed Pricing
|
View Detailed Pricing
|
View Detailed Pricing
|
View Detailed Pricing
|
Get personalized recommendations from our experts on call
Trusted by more than 5 Million users across the globe.
Thank you for the enquiry. One of our software analysts will contact you soon.
| Screenshots |
+ 9 More
|

+ 2 More
|

+ 3 More
|

+ 3 More
|
| Videos |

|
+ 2 More
|

|
Not Available |
| Company Details | Located in: Saint Paul, MN | Located in: Redwood City, California Founded in: 2018 | Located in: New York, New York Founded in: 2014 |
Not available |
| Contact Details |
1-888-624-4671 |
Not available |
Not available |
Not available |
| Social Media Handles |
|
|
|
|
Looking for the right SaaS
We can help you choose the best SaaS for your specific requirements. Our in-house experts will assist you with their hand-picked recommendations.
Want more customers?
Our experts will research about your product and list it on SaaSworthy for FREE.