|
95% SW Score The SW Score ranks the products within a particular category on a variety of parameters, to provide a definite ranking system. Read more
Start Free Trial
|
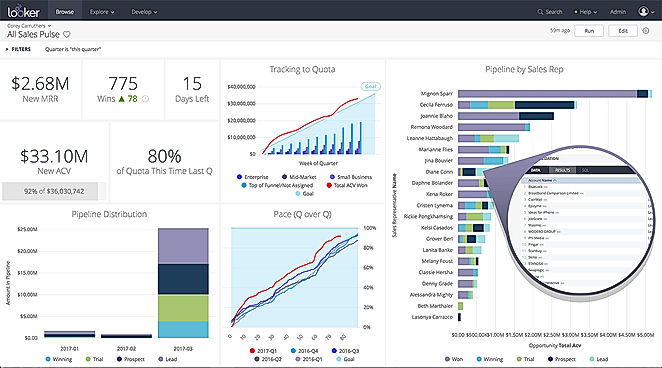
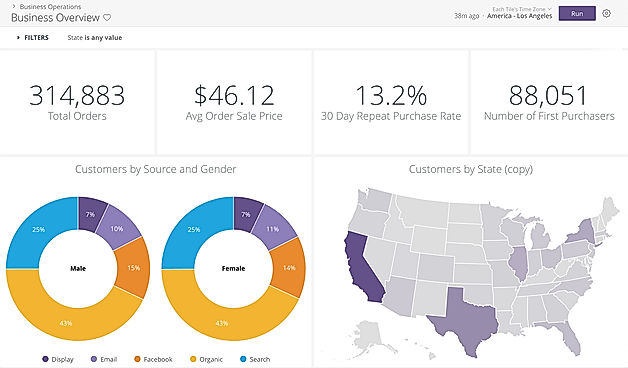
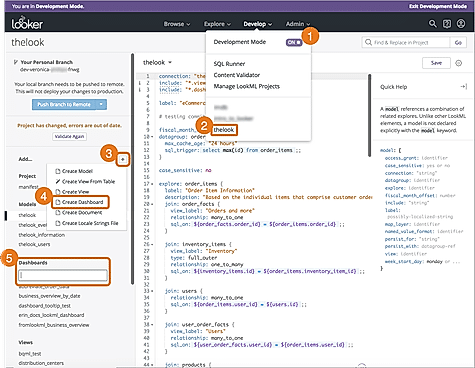
| Description | Looker is a business intelligence and data visualization platform that aims to provide everyone with access to useful data in a unified view in an easy-to-understand format through its centralized platform. Looker’s pre-built applications and blocks can help your company get up and running quicker by speeding up the process of customization. Looker’s LookML data modeling language gives data analysts a way to define business metrics, as well as find correlations between data and tables. Looker’s data visualization features lets you build more beautiful ways to display your data, that can be understand by both data scientists and business users alike. Its reports and dashboards let you drill down into key metrics so you can get a better understanding of what is happening, and apply this across your business to make improvements to operations. You can also share these data visualizations from any device. Read more | I Love Numbers is an accounting tool that generates a scorecard of key performance indicators of the company directly through the Quickbooks data. The tool has an elegant interface that showcases all the key financial metrics of the company in formats such as dashboards, scorecards, benchmarks, goals, advanced reports, and prescriptive analytics. Users can set and track goals, detect trends, create reports, and more in real-time. They don’t have to go through the hassle of deciphering the data as the tool does it for them. The tool works with both Quickbooks online and Quickbooks Desktop versions. With better visibility about the finances of the business, users can drive more visibility into processes. It automatically captures financial data so that employees do not hand to keep track of spreadsheets. Key features include four brandable color schemes and Real scorecards with real data in real time. Read more |
| Pricing Options |
|
|
| SW Score & Breakdown |
95% SW Score The SW Score ranks the products within a particular category on a variety of parameters, to provide a definite ranking system. Read more
|
|
| SaaSworthy Awards | # 13 Highly Rated # 8 Most Popular |
Not Available
|
| Total Features |
10 Features
|
9 Features
|
| Common Features for All |
Ad hoc Analysis
Ad hoc Query
Ad hoc Reports
Benchmarking
Dashboard
Data Analysis
Key Performance Indicators
Profitability Analysis
Strategic Planning
Trend Indicators
|
Ad hoc Analysis
Ad hoc Query
Ad hoc Reports
Benchmarking
Dashboard
Data Analysis
Key Performance Indicators
Profitability Analysis
Strategic Planning
Trend Indicators
|
| Organization Types Supported |
|
|
| Platforms Supported |
|
|
| Modes of Support |
|
|
| API Support |
|
|
| User Rating |
|
Not Available
|
| Ratings Distribution |
|
Not Available
|
| Review Summary |
Overall, Looker receives positive feedback for its user-friendly interface, robust data visualization capabilities, and ability to connect to a wide range of data sources. Praised for its ease of use and ability to empower business users with self-service analytics, Looker is seen as a valuable tool for data exploration and insights generation. However, some users mention challenges with performance and scalability, particularly when working with large datasets. Additionally, a few reviewers express concerns regarding the cost and complexity of implementation. |
Not Available
|
| Read All User Reviews | Read All User Reviews |
AI-Generated from the text of User Reviews
| Pricing Options |
|
|
|
Pricing Plans
Monthly Plans
Annual Plans
|
Looker Custom |
I Love Numbers Custom |
|
View Detailed Pricing
|
|
|
|
|
| Screenshots |
+ 2 More
|
Not Available |
| Videos |

+ 2 More
|
Not Available |
| Company Details | Located in: Santa Cruz, California | Located in: Plano, Texas - 75024 |
| Contact Details |
+1‑831‑244‑0340 https://looker.com/ |
(972) 736-8810 https://www.ilovenumbers.com/ |
| Social Media Handles |
|
|
Looking for the right SaaS
We can help you choose the best SaaS for your specific requirements. Our in-house experts will assist you with their hand-picked recommendations.
Want more customers?
Our experts will research about your product and list it on SaaSworthy for FREE.