|
94% SW Score The SW Score ranks the products within a particular category on a variety of parameters, to provide a definite ranking system. Read more
View Details
|
94% SW Score The SW Score ranks the products within a particular category on a variety of parameters, to provide a definite ranking system. Read more
Start Free Trial
|
90% SW Score The SW Score ranks the products within a particular category on a variety of parameters, to provide a definite ranking system. Read more
View Details
|
Sponsored
98% SW Score The SW Score ranks the products within a particular category on a variety of parameters, to provide a definite ranking system. Read more
Visit Website
|
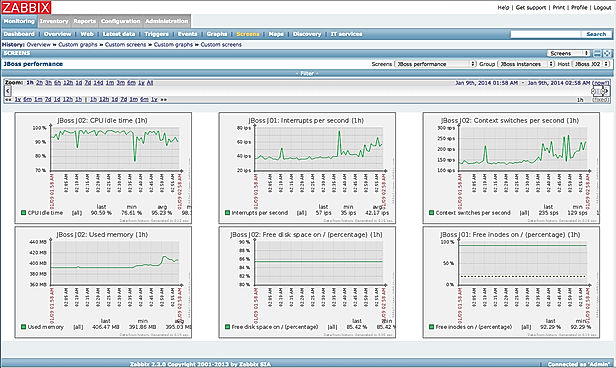
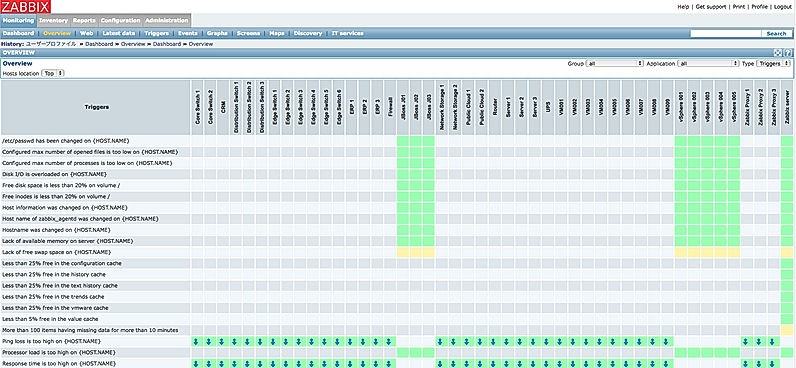
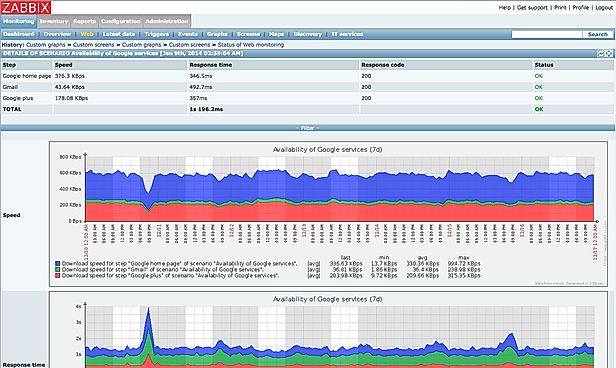
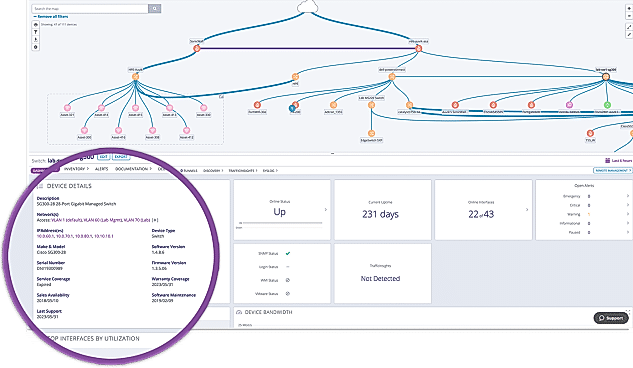
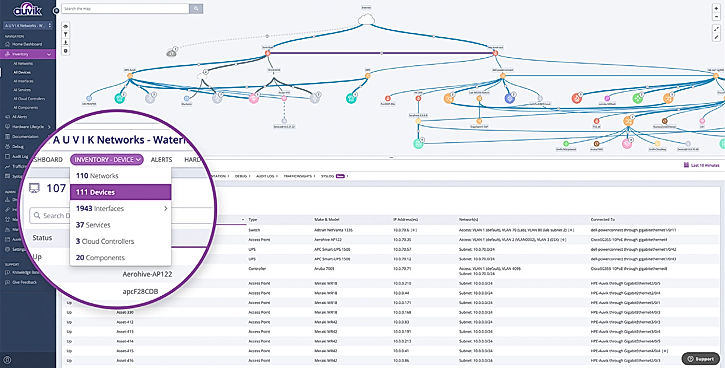
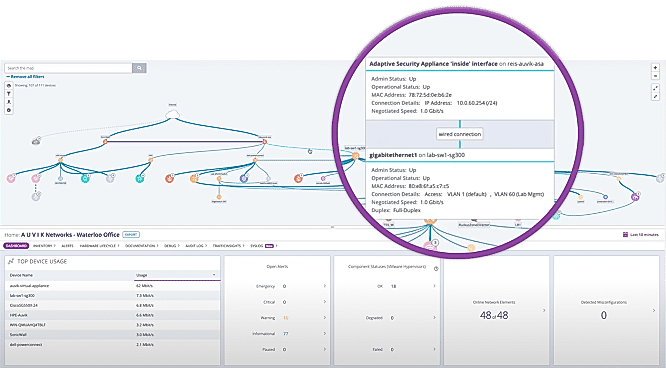
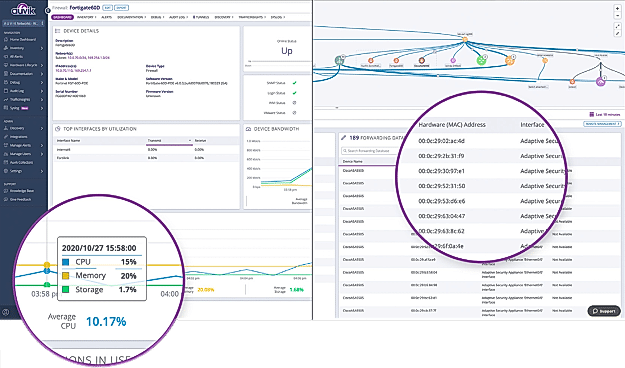
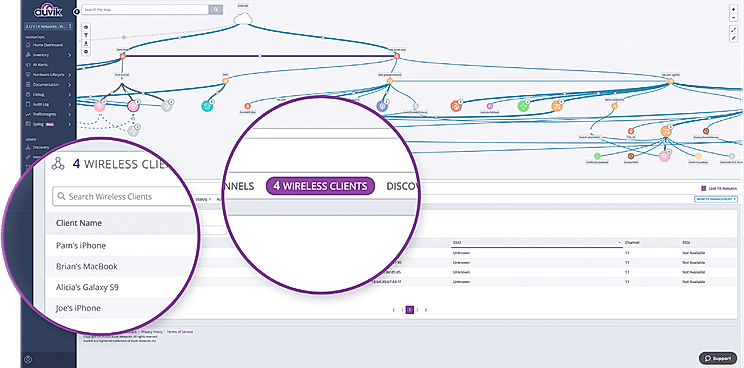
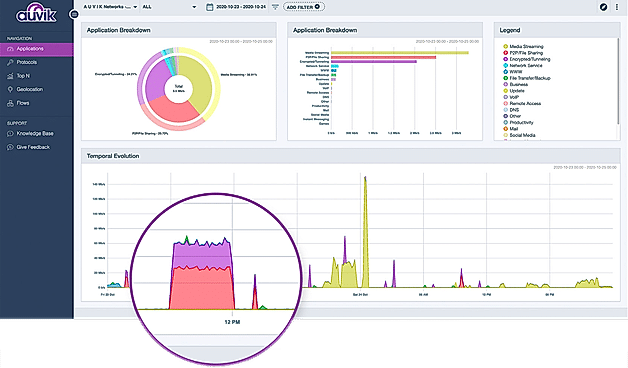
| Description | Zabbix is a network monitoring software that allows real-time network performance monitoring and management.You can monitor internet usage, bandwidth, IP address, uptime, server etc.The software comes designed with real time analytics, diagnostic tools and web traffic reporting.It helps in resource management as well.The platform is highly scalable. Zabbix Monitoring Solution notifies you if the power supply is critical, device temperature is excessively high/low, low free disk space etc.The tool is optimized for better performance and allows 3rd party software integration. It further includes features like security authentication, templating, autodiscovery etc. Read more | Grafana is software that assists companies to monitor everything from Prometheus & Graphite metrics, logs, applications, beehives, power plants, sourdough starters, and custom data sources. It makes metric visualization tools that are more accessible and easy to use across the entire company. Grafana cloud plan collects, analyzes, and alerts users on Graphite and Prometheus metrics and Loki logs on highly available, high-performance, and fully managed Grafana Cloud platforms. Users can get visibility into all data sources and metrics across their teams without jumping through multiple tabs and tools. The platform enables users to get massive query performance and high efficiency for their Prometheus metrics at any scale. Users can also access Grafana Enterprise, which includes access to enterprise plugins that take users' existing data sources and allow them to drop them right into Grafana. This will enable users to get the best out of their complicated and expensive monitoring solutions and databases by visualizing all the data more easily and effectively. Read more | Companies depend on Pandora FMS to get their monitoring needs taken care of in a simple and secure way. The particular tool is designed by Artica ST and comes loaded with a full-fledged ecosystem inclusive of facilities like personalised face to face training, technical support, distance training, certified international partners, community version developers and an intuitive plugin library alike. Further, it is also capable of integrating information islands of SAP, servers, Mainframe, IP telephony, applications or communications within a unified monitoring umbrella. The platform is absolutely secure, compatible with stringent security standards like SO 27001 and PCI/DSS. Its integrated list of secure architecture elements comes loaded with metrics like delegated authentication system, safe traffic through certificates and encryptions, double authentication system, internal audit system, password policy, credential storages, rootless installation, agent communication based safe architecture and integrated backup. Pandora FMS is certified under ISO/IEC 27001:2013 besides complying with National Security Scheme. Read more | Auvik is cloud-based network management software. Complete your network picture with automated network discovery, inventory, and documentation that updates in real-time as the network evolves. Respond to network issues in real-time and dive deep into problems with Syslog so your users are always connected to the business-critical resources they need to do their job. Quickly see the big network picture, narrow down possible devices to investigate, and zoom in to get the info you need. Remotely connect network devices in Auvik’s inventory and troubleshoot issues without ever leaving your desk. Read more |
| Pricing Options |
|
|
|
|
| SW Score & Breakdown |
94% SW Score The SW Score ranks the products within a particular category on a variety of parameters, to provide a definite ranking system. Read more
|
94% SW Score The SW Score ranks the products within a particular category on a variety of parameters, to provide a definite ranking system. Read more
|
90% SW Score The SW Score ranks the products within a particular category on a variety of parameters, to provide a definite ranking system. Read more
|
98% SW Score The SW Score ranks the products within a particular category on a variety of parameters, to provide a definite ranking system. Read more
|
| SaaSworthy Awards |
Not Available
|
# 5 Fastest Growing # 2 Most Popular |
Not Available
|
Not Available
|
| Organization Types Supported |
|
|
|
|
| Platforms Supported |
|
|
|
|
| Modes of Support |
|
|
|
|
| API Support |
|
|
|
|
| User Rating |
|
|
|
|
| Rating Distribution |
|
|
|
|
| User Sentiments |
Customizable Monitoring, Comprehensive Monitoring Capabilities, Open Source, Real-Time Alerting Steep Learning Curve, Outdated User Interface, Complicated Setup Process, Limited Reporting Functionality |
Easy to Use Interface, Extensive Customization Options, Powerful Visualization Capabilities, Wide Range of Data Source Integrations Steep Learning Curve, Slow Loading Times, Limited Alerting Functionality, Complex Querying Language |
Flexibility, Real-time Monitoring, Customizable Dashboards, Comprehensive Monitoring Capabilities Initial Setup Complexity, Outdated User Interface, Limited Free Version, Occasional Software Crashes |
Easy to Use Interface, Automatic Network Mapping, Comprehensive Network Monitoring, Extensive Integrations Network Map Issues, High Pricing, Alert Configuration Challenges, Limited Server Resource Monitoring |
| Review Summary |
Overall, users find the software easy to use, praising its intuitive interface, user-friendly dashboards, and customizable features. It is lauded for its comprehensive monitoring capabilities, including network monitoring, server monitoring, and application monitoring, with users appreciating its ability to detect and alert on issues promptly. However, some users have reported occasional bugs and performance issues, and a few have expressed concerns about the complexity of the software and the need for specialized skills for full utilization. |
Grafana is widely praised for its powerful visualization capabilities, allowing users to create custom dashboards that provide insightful views of data from a variety of sources. Users appreciate its flexibility, extensive plugin library, and ease of integration with various monitoring tools. However, some users find the initial setup and configuration process complex, and point to limitations in its alerting capabilities. Despite these drawbacks, Grafana remains a popular choice for monitoring and analysis, particularly for those seeking a customizable open-source solution. |
Pandora FMS is a highly customizable and powerful monitoring solution praised by users for its comprehensive capabilities. While users appreciate its flexibility in monitoring various systems, including networks, servers, applications, and cloud services, some find the initial setup and configuration complex. The software's real-time alerts and detailed reports are valued assets, though the user interface could be modernized. Despite a few minor drawbacks, Pandora FMS offers robust monitoring capabilities at a competitive price, making it a reliable choice for organizations seeking to enhance their IT infrastructure management. |
Users praise Auvik for its user-friendly interface, powerful network monitoring capabilities, and excellent customer support. They appreciate its ability to provide comprehensive visibility into network performance, identify and troubleshoot issues quickly, and generate detailed reports for analysis. Additionally, users highlight Auvik's scalability, flexibility, and compatibility with various devices and platforms. However, some users mention occasional glitches and performance issues, particularly when dealing with large networks. Overall, Auvik is highly regarded for its ease of use, powerful features, and exceptional customer support. |
| Read All User Reviews | Read All User Reviews | Read All User Reviews | Read All User Reviews |
AI-Generated from the text of User Reviews
| Pricing Options |
|
|
|
|
|
Pricing Plans
Monthly Plans
Annual Plans
|
Zabbix Free |
Free Free Grafana Cloud Pro $49.00 $49.00 per month Advanced Custom |
Lite Others Enterprise Custom Corporate Custom |
ESSENTIALS Custom PERFORMANCE Custom |
|
View Detailed Pricing
|
View Detailed Pricing
|
View Detailed Pricing
|
View Detailed Pricing
|
|
SolarWinds Network Performance Monitor
4.4 Based on 448 Ratings Zabbix Vs SolarWinds Network Performance Monitor |
Klipfolio Dashboard
4.7 Based on 778 Ratings |
|
||
| Screenshots |
+ 3 More
|

+ 3 More
|
Not Available |
+ 5 More
|
| Videos |

|

|

|
|
| Company Details | Located in: Riga, Latvia | Located in: New York, New York Founded in: 2014 | Located in: Madrid, Spain | Located in: Waterloo, Canada Founded in: 2011 |
| Contact Details |
+371 6778-4742 https://www.zabbix.com/network_monitoring |
Not available https://grafana.com/ |
+34-91-559-72-22 https://pandorafms.com/pandora-fms-enterprise/ |
1-226-214-0841 https://www.auvik.com/ |
| Social Media Handles |
|
|
|
|
Looking for the right SaaS
We can help you choose the best SaaS for your specific requirements. Our in-house experts will assist you with their hand-picked recommendations.
Want more customers?
Our experts will research about your product and list it on SaaSworthy for FREE.