|
95% SW Score The SW Score ranks the products within a particular category on a variety of parameters, to provide a definite ranking system. Read more
View Details
|
92% SW Score The SW Score ranks the products within a particular category on a variety of parameters, to provide a definite ranking system. Read more
View Details
|
83% SW Score The SW Score ranks the products within a particular category on a variety of parameters, to provide a definite ranking system. Read more
View Details
|
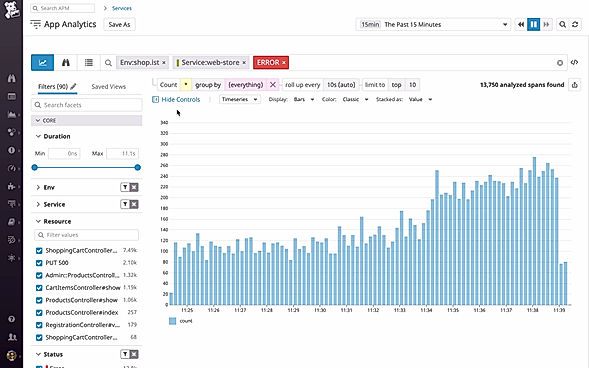
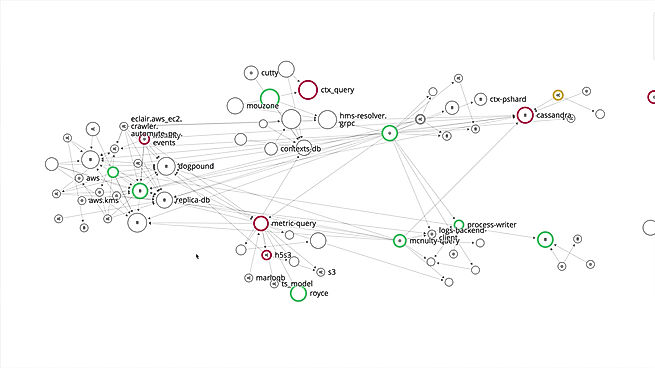
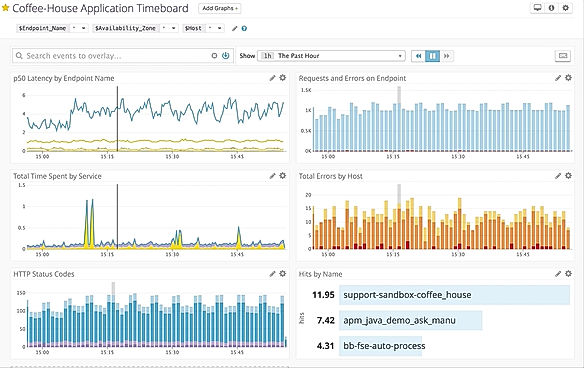
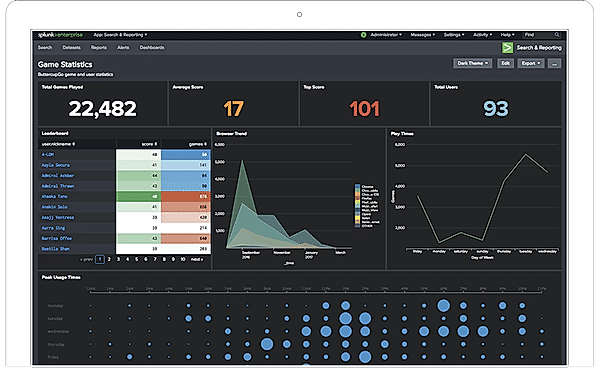
| Description | This is a cloud-based application monitoring tool for infrastructure, event logs, and applications. Users can search, collect and analyse traces across fully distributed platforms. This helps in narrowing down from a global perspective to one single customer’s particular line of code or request trace. This tool helps in tracking data flows automatically and cluster services based on their interdependencies in real-time. It also provides machine learning-based Watchdog to surface and auto-detect errors with zero configuration. Datadog APM can auto trace requests from any popular library or framework. Integrations with web frameworks such as Django, Ruby on Rails, Laravel, and Spring gives instant visibility into anomalies. Datadog also enables users to find traces that match a particular customer, user, error code, custom tag or service. Read more | AppDynamics is an Application Performance Management Solution helping out organizations, in aligning their business outcomes with IT. It uses tools like CloudMonitoring, DevOps, Cloudmigration & unified Monitoring to gain the most efficient method of performance boosting. AppDynamics offers detailed observability facilitating enhanced business decisions, using modules like infrastructure monitoring, multi cloud monitoring, end user monitoring, network monitoring and more. Enterprises get access to mechanisms like dynamic baselining, application mapping and code-level diagnostics. An intuitive cognition engine within the particular uses machine learning to get anomalies detected in an automated manner. Moreover, enterprises also get to pinpoint the root cause of code-related issues and get them resolved in real-time. They can also analyze the performance levels of individual applications and their potential impact on business returns. The network monitoring solutions offered by AppDynamics, enables organizations to isolate the performance issues related to the networks which are in charge of driving particular business applications. Read more | Splunk Cloud is an intuitive data management and optimisation platform that helps companies with their searches, visualisation, analyses and acting on relevant data that is useful for the overall growth. The platform allows users to search out any type of data in real-time. Thus helping them to gain access to the latest streaming and machine learning capabilities on the go. This way developers can detect and prevent issues before even they occur. Also, Splunk Cloud allows companies to retrieve data in real-time, all at once and use it multiple times to address various issues across a variety of programs and initiatives. From data compliance to infrastructure management, the platform helps users to get all of their analytical needs streamlined, efficiently. It is designed in a way, that is capable of managing multiple bursts of data volume simultaneously. At present, Splunk Cloud is utilised by a variety of industries, related to financial services, health care, the public sector and more. Read more | Prometheus is a metrics-based monitoring system that is designed to track an organisation's overall health, performance and behaviour. It gathers, organises and stores real-time metrics besides delivering intuitive alerts in no time. The software uses dimensional data modelling, flexible query language, modern alerting techniques and an effective time-series database to provide elegant monitoring solutions. With a cleverly designed interface and futuristic features, Prometheus delivers excellent insights derived from a variety of metrics. By implementing a highly dimensional data tool and key-value pairs, it converts data into meaningful insights. This efficient monitoring solution enables users to slice and dice collected time series data through PromQL and generate informative graphs, tables, and alerts as per convenience. Prometheus also comes loaded with a variety of sophisticated templates facilitating seamless data visualisation and integrated Grafana functionality. Furthermore, it provides an efficient storage facility for time series besides working on a simple yet reliable server. The platform’s alerting approach is rooted in PromQL and is flexibly designed. Lastly, this open-source software is completely community-driven and highly secure as well. Read more |
| Pricing Options |
|
|
|
|
| SW Score & Breakdown |
95% SW Score The SW Score ranks the products within a particular category on a variety of parameters, to provide a definite ranking system. Read more
|
92% SW Score The SW Score ranks the products within a particular category on a variety of parameters, to provide a definite ranking system. Read more
|
83% SW Score The SW Score ranks the products within a particular category on a variety of parameters, to provide a definite ranking system. Read more
|
|
| Organization Types Supported |
|
|
|
|
| Platforms Supported |
|
|
|
|
| Modes of Support |
|
|
|
|
| API Support |
|
|
|
|
| User Rating |
|
|
|
|
| Rating Distribution |
|
|
|
|
| User Sentiments |
Comprehensive Monitoring, Customizable Dashboards, Extensive Integrations, Real-Time Monitoring High Pricing, Steep Learning Curve, Agent Performance Issues, Occasional UI/UX Confusion |
In-depth Performance Insights, Transaction Tracing, Real-Time Monitoring, Customizable Dashboards High Cost, Steep Learning Curve, Limited Log Management, Occasional Performance Issues |
Not Available
|
Easy to Install and Configure, Extensive Integrations, Customizable Metrics, Efficient Monitoring Complex Query Language (PromQL), Limited Built-in Visualization, Steep Learning Curve, Lack of Detailed Documentation |
| Review Summary |
Users appreciate Datadog's comprehensive monitoring capabilities, customizable dashboards, and user-friendly interface. They also value its ability to integrate with various tools and platforms, enabling seamless data collection and analysis. However, some users have expressed concerns regarding the complexity of setting up and configuring the tool, as well as its occasional performance issues and limited reporting capabilities. Overall, Datadog receives positive feedback for its robust monitoring features and integration options, but it could benefit from improvements in ease of use, performance stability, and reporting functionality. |
AppDynamics garners widespread praise for its robust application performance monitoring capabilities and insightful analytics that empower users to proactively identify and resolve performance issues. Reviewers commend its user-friendly interface, customizable dashboards, and ability to monitor complex IT environments effectively. Additionally, its real-time monitoring and alerting features are valued for enhancing observability and ensuring service availability. While some users mention occasional connectivity issues and a steep learning curve, the overall sentiment is positive, highlighting AppDynamics' effectiveness in optimizing application performance and ensuring business continuity. |
Not Available
|
Users praise Prometheus for its robust monitoring capabilities, highlighting its user-friendly interface, extensive metrics library, and flexible alerting system. They appreciate its ability to collect and visualize data from diverse sources, enabling comprehensive monitoring of IT infrastructure and applications. Additionally, users commend Prometheus's open-source nature, strong community support, and active development, ensuring continuous improvements and feature enhancements. While some users mention occasional performance issues or a learning curve for new users, the overall sentiment is overwhelmingly positive, reflecting Prometheus's effectiveness as a monitoring solution. |
| Read All User Reviews | Read All User Reviews | Read All User Reviews | Read All User Reviews |
AI-Generated from the text of User Reviews
| Pricing Options |
|
|
|
|
|
Pricing Plans
Monthly Plans
Annual Plans
|
APM and Distributed Tracing $31.00 $36.00 per user / month |
APM Pro Custom APM Advanced Custom APM Peak Custom Real User Monitoring Pro Custom Real User Monitoring Peak Custom |
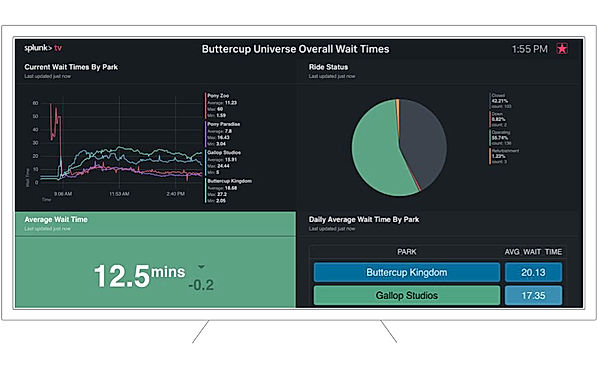
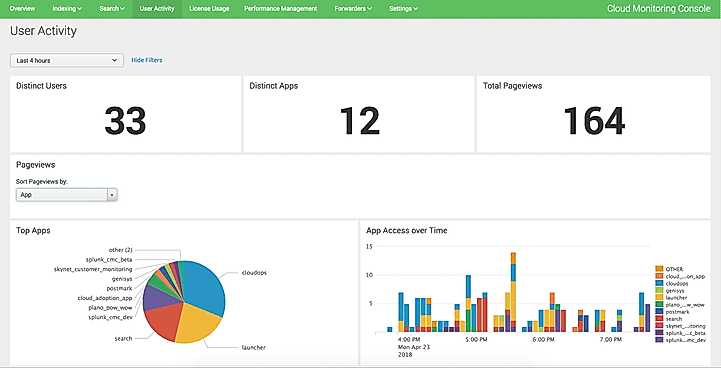
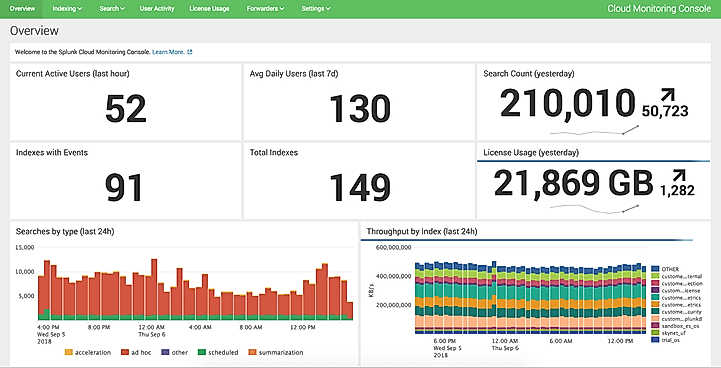
Splunk Cloud Custom |
Prometheus Custom |
|
View Detailed Pricing
|
View Detailed Pricing
|
View Detailed Pricing
|
View Detailed Pricing
|
Get personalized recommendations from our experts on call
Trusted by more than 5 Million users across the globe.
Thank you for the enquiry. One of our software analysts will contact you soon.
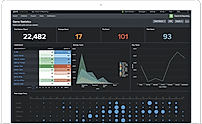
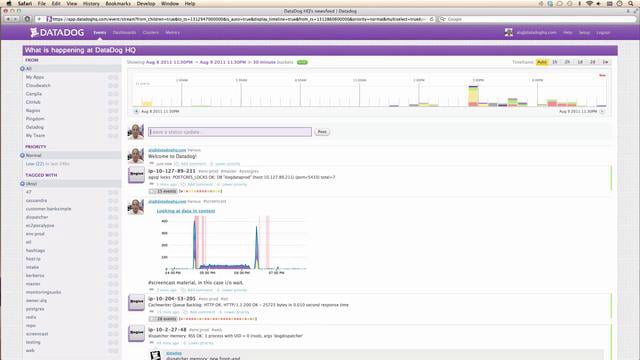
| Screenshots |
+ 2 More
|

+ 1 More
|
+ 3 More
|

+ 3 More
|
| Videos |
+ 1 More
|

+ 1 More
|

+ 1 More
|
Not Available |
| Company Details | Located in: New York, NY Founded in: 2010 | Located in: San Francisco, California Founded in: 2008 | Located in: San Francisco, California |
Not available |
| Contact Details |
+1 866-329-4466 |
Not available |
+1 415-848-8400 |
Not available |
| Social Media Handles |
|
|
Not available |
|
Looking for the right SaaS
We can help you choose the best SaaS for your specific requirements. Our in-house experts will assist you with their hand-picked recommendations.
Want more customers?
Our experts will research about your product and list it on SaaSworthy for FREE.