This product profile is currently unclaimed.
The listing is published on SaaSworthy, but the official vendor does not yet manage it. Are you part of the Infogram team? Claim this profile to manage and update your product information.
Infogram is a software to create beautiful, interactive and responsive data visualizations. Charts, maps and infographics. It helps to create interactive charts and graphs your audience can explore using Infogram tabs. Add links to increase engagement and drive traffic to your site.
Read more

Pricing
SW Score Breakdown
Platforms Supported
Organization Types Supported
API Support
Modes of Support


Built-in Templates
It has bundle of predefined templates that can be used for creating a designPremium Icons
It is equipped with set of predefined icons that can be used in the designPrivacy Control
It allows only authorized user to access the fileImage Editor
It allows editing and designing image filesTransparency Tool
It allows to intext fonts in the imagesFree Trial
Not available
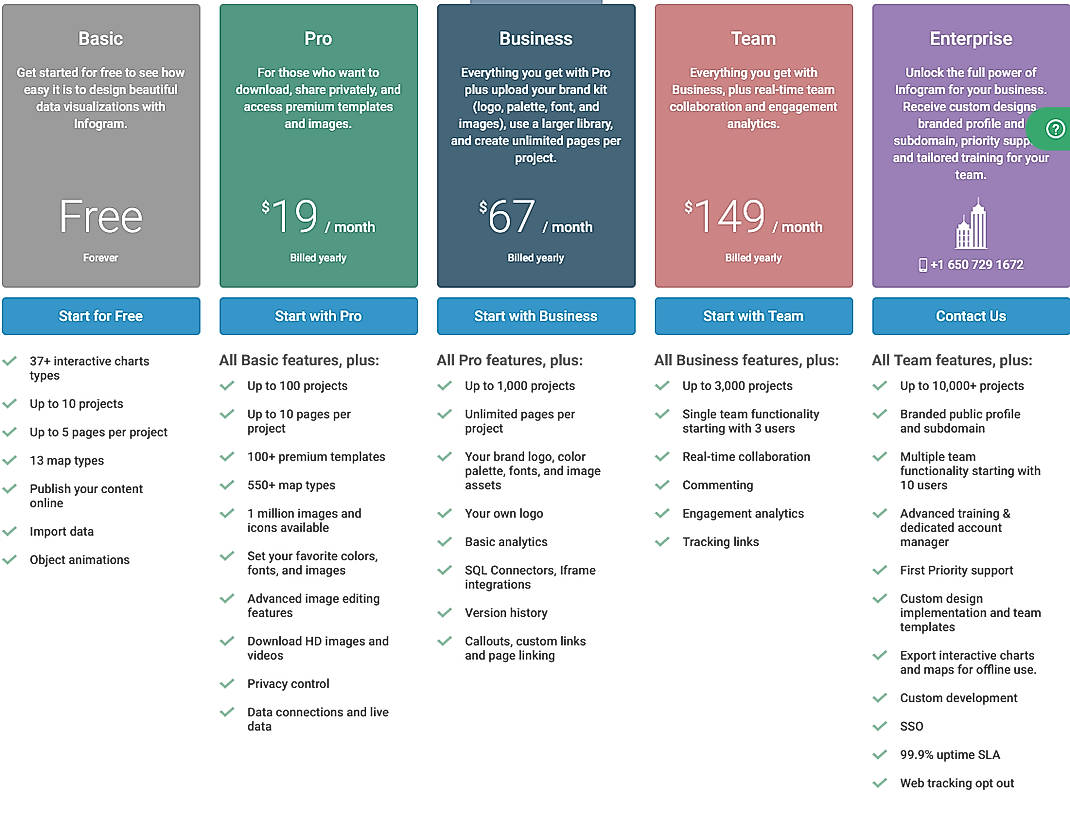
Basic Free
Free Forever
Features
Pro $19.00 $25.00 per month
Features
Business $67.00 $79.00 per month
Features
Team $149.00 $179.00 per month
Features
Enterprise Custom
Features
Screenshots of Vendor Pricing Page
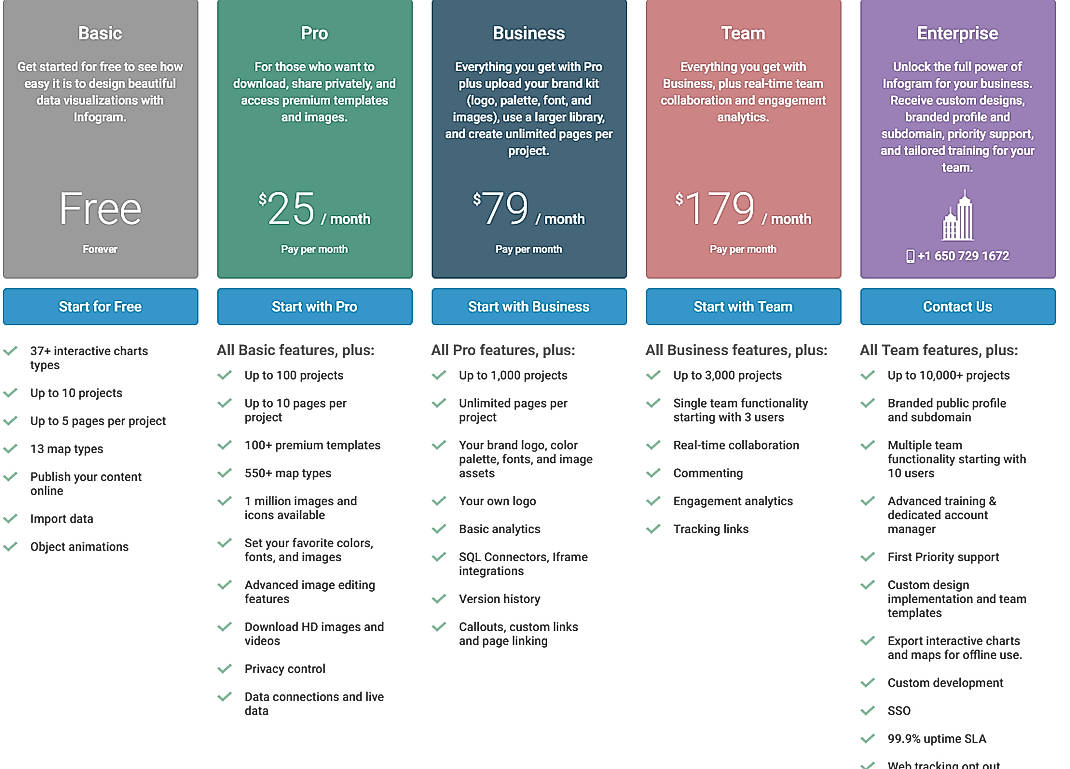
Disclaimer: The pricing details were last updated on 16/10/2018 from the vendor website and may be different from actual. Please confirm with the vendor website before purchasing.
Learn more about Infogram Pricing
98% SW Score The SW Score ranks the products within a particular category on a variety of parameters, to provide a definite ranking system. Read more
90% SW Score The SW Score ranks the products within a particular category on a variety of parameters, to provide a definite ranking system. Read more
94% SW Score The SW Score ranks the products within a particular category on a variety of parameters, to provide a definite ranking system. Read more
87% SW Score The SW Score ranks the products within a particular category on a variety of parameters, to provide a definite ranking system. Read more
98% SW Score The SW Score ranks the products within a particular category on a variety of parameters, to provide a definite ranking system. Read more
86% SW Score The SW Score ranks the products within a particular category on a variety of parameters, to provide a definite ranking system. Read more

How to Create Soc...
What is Infogram

Getting started w...
What is Infogram used for?
Infogram is Graphic Design Software. Infogram offers the following functionalities:
Learn more about Infogram features.
What are the top alternatives for Infogram?
Here`s a list of the best alternatives for Infogram:
Does Infogram provide API?
Yes, Infogram provides API.
Vendor Details
Riga, Latvia Founded : 2012Social Media Handles
This research is curated from diverse authoritative sources; feel free to share your feedback at [email protected]
Looking for the right SaaS
We can help you choose the best SaaS for your specific requirements. Our in-house experts will assist you with their hand-picked recommendations.
Want more customers?
Our experts will research about your product and list it on SaaSworthy for FREE.