Snowflake |
96% SW Score The SW Score ranks the products within a particular category on a variety of parameters, to provide a definite ranking system. Read more
Start Free Trial
|
86% SW Score The SW Score ranks the products within a particular category on a variety of parameters, to provide a definite ranking system. Read more
Start Free Trial
|
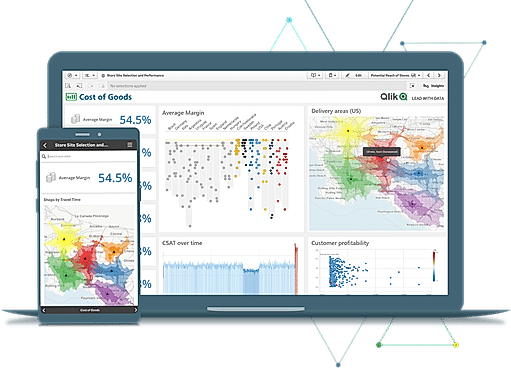
| Description | Qlik Sense is a smart analytics tool to generate personalized reports and dashboards instantly. It allows easy navigation through a huge amount of data and collects detailed information. It provides smart visualizations and can be integrated with the QIX engine which makes it more interactive. Also, it has a smart data load feature which enhances the ability to complete common tasks quickly with a click and go approach. It supports customization to meet unique business requirements. Along with this, it supports robust integration that can be used to transform and combine multiple data sources to provide smooth data analysis. Read more | The enterprise-grade data processing engines used by Qubole, a fully self-service multi-cloud data platform, include Apache Spark, Presto, Hive, Quantum, Airflow, and more. To reduce administrative burden, it automatically configures, manages, and optimises cloud resources while balancing cost, workloads, and performance requirements. It employs a multi-layer strategy to safeguard the availability, confidentiality, and integrity of consumer information. It provides the industry's most cutting-edge big data financial governance. It has a vast list of features such as - Construction of machine learning models, Faster Data Scientific model development, deployment, and iteration can be accelerated by: Trial Monitoring, Front end tool integrations out of the box include RStudio, H2O.ai, and Data robot, Schedulers and Airflow-anchored End-to-End Workflows, Managed Notebooks - Offline (Serverless) Editing. One of its most beneficial features is Automated Infrastructure Provisioning - automatically reduce costs while accommodating an increase in concurrent users without affecting performance. No matter how many users or model versions there are, the management overhead should be almost nil. Automatically scale up or down to accommodate all workloads at any given time. Ecosystem partners like Rstudio, Google Cloud, Amazon SageMaker. Read more |
| Pricing Options |
|
|
| SW Score & Breakdown |
96% SW Score The SW Score ranks the products within a particular category on a variety of parameters, to provide a definite ranking system. Read more
|
86% SW Score The SW Score ranks the products within a particular category on a variety of parameters, to provide a definite ranking system. Read more
|
| SaaSworthy Awards | # 2 Highly Rated # 5 Fastest Growing |
Not Available
|
| Total Features |
10 Features
|
5 Features
|
| Common Features for All |
Ad hoc Analysis
Ad hoc Query
Ad hoc Reports
Benchmarking
Dashboard
Data Analysis
Key Performance Indicators
Profitability Analysis
Strategic Planning
Trend Indicators
|
Ad hoc Analysis
Ad hoc Query
Ad hoc Reports
Benchmarking
Dashboard
Data Analysis
Key Performance Indicators
Profitability Analysis
Strategic Planning
Trend Indicators
|
| Organization Types Supported |
|
|
| Platforms Supported |
|
|
| Modes of Support |
|
|
| API Support |
|
| User Rating |
|
|
| Ratings Distribution |
|
|
| Review Summary |
Overall, users find the product easy to use and visually appealing, praising its intuitive interface and customizable dashboards. They commend its data visualization capabilities, enabling them to create interactive and visually appealing reports. Additionally, users appreciate the drag-and-drop functionality and the wide range of available connectors, making it easy to integrate with other systems. However, some users report performance issues, particularly with large datasets. They also mention the need for improved customer support and documentation, as well as more advanced features for data analysis and machine learning. |
Qubole garners positive feedback for its user-friendly interface, ease of use, and the ability to efficiently handle large datasets. Users appreciate its scalability, flexibility, and support for various data sources and formats. The platform's data processing capabilities and machine learning integration are also praised. However, some reviewers express concerns regarding its pricing and occasional performance issues. Additionally, the need for technical expertise for certain tasks and the complexity of some features are mentioned as areas for improvement. |
| Read All User Reviews | Read All User Reviews |
AI-Generated from the text of User Reviews
| Pricing Options |
|
|
|
Pricing Plans
Monthly Plans
Annual Plans
|
Qlik Sense $20.00 $20.00 per user / month |
Free Test Drive Free Qubole Data Platform - Enterprise Edition $0.14 $0.14 |
|
View Detailed Pricing
|
View Detailed Pricing
|
|
|
Amazon EMR
4.2 Based on 85 Ratings |
|
| Screenshots |
|

+ 1 More
|
| Videos |

+ 2 More
|

+ 3 More
|
| Company Details | Located in: King of Prussia, Pennsylvania | Founded in: 2011 |
| Contact Details |
+1 888-828-9768 https://www.qlik.com/us/products/qlik-sense |
Not available https://www.qubole.com/ |
| Social Media Handles |
|
|
Looking for the right SaaS
We can help you choose the best SaaS for your specific requirements. Our in-house experts will assist you with their hand-picked recommendations.
Want more customers?
Our experts will research about your product and list it on SaaSworthy for FREE.