Sisense |
95% SW Score The SW Score ranks the products within a particular category on a variety of parameters, to provide a definite ranking system. Read more
Start Free Trial
|
78% SW Score The SW Score ranks the products within a particular category on a variety of parameters, to provide a definite ranking system. Read more
Start Free Trial
|
Sponsored
85% SW Score The SW Score ranks the products within a particular category on a variety of parameters, to provide a definite ranking system. Read more ManageEngine Analytics Plus
Visit Website
|
| Description | Looker is a business intelligence and data visualization platform that aims to provide everyone with access to useful data in a unified view in an easy-to-understand format through its centralized platform. Looker’s pre-built applications and blocks can help your company get up and running quicker by speeding up the process of customization. Looker’s LookML data modeling language gives data analysts a way to define business metrics, as well as find correlations between data and tables. Looker’s data visualization features lets you build more beautiful ways to display your data, that can be understand by both data scientists and business users alike. Its reports and dashboards let you drill down into key metrics so you can get a better understanding of what is happening, and apply this across your business to make improvements to operations. You can also share these data visualizations from any device. Read more | Columns are the ultimate tool for creating engaging and persuasive data stories! As a storyteller, they know that numbers and data are just the beginning - it's the story they weave around them that truly captures their audience's attention. And with Columns, they can take their data storytelling to the next level. Gone are the days of boring, lifeless charts and graphs. With Columns, they have the power to maximize their influence by using shapes, colors, annotations, and animations to bring their data to life. Their audience will be captivated as they build vivid stories to share, making their message more persuasive and memorable. But Columns isn't just about creating impressive data visualizations - it's also about collaboration and ease of communication. With one-click integration to popular platforms like Slack, sharing their stories with their team has never been easier. Instant feedback and collaboration allow them to fine-tune their message and ensure that their insights are reaching their audience effectively. This user-friendly interface makes it easy for anyone to unleash their creativity and design stories collaboratively with their team. Read more | Make your data more useful than ever before with advanced analytics and feature-rich dashboards from ManageEngine Analytics Plus. You can connect to any data source and upload files, spreadsheets, URL feeds and a lot more with absolute ease. Build complex reports on its easy-to-use interface and represent your data on a variety of charts, widgets and tabular views. You can also combine multiple reports and view it on a single dashboard and use its powerful formula engine to derive metrics from complex data and reports. Integrate with ManageEngine’s ITSM, support and IT support suite and get a better insight into your helpdesk and customer support operations. Read more |
| Pricing Options |
|
|
|
| SW Score & Breakdown |
95% SW Score The SW Score ranks the products within a particular category on a variety of parameters, to provide a definite ranking system. Read more
|
78% SW Score The SW Score ranks the products within a particular category on a variety of parameters, to provide a definite ranking system. Read more
|
85% SW Score The SW Score ranks the products within a particular category on a variety of parameters, to provide a definite ranking system. Read more
|
| SaaSworthy Awards | # 13 Highly Rated # 8 Most Popular |
Not Available
|
Not Available
|
| Total Features |
10 Features
|
3 Features
|
7 Features
|
| Common Features for All |
Ad hoc Analysis
Ad hoc Query
Ad hoc Reports
Benchmarking
Dashboard
Data Analysis
Key Performance Indicators
Profitability Analysis
Strategic Planning
Trend Indicators
|
Ad hoc Analysis
Ad hoc Query
Ad hoc Reports
Benchmarking
Dashboard
Data Analysis
Key Performance Indicators
Profitability Analysis
Strategic Planning
Trend Indicators
|
Ad hoc Analysis
Ad hoc Query
Ad hoc Reports
Benchmarking
Dashboard
Data Analysis
Key Performance Indicators
Profitability Analysis
Strategic Planning
Trend Indicators
|
| Organization Types Supported |
|
|
|
| Platforms Supported |
|
|
|
| Modes of Support |
|
|
|
| API Support |
|
|
|
| User Rating |
|
Not Available
|
|
| Rating Distribution |
|
Not Available
|
|
| User Sentiments |
Ease of Use, Excellent Customer Support, Data Visualization Capabilities, Extensive Integrations Slow Loading Times, Limited Visualization Customizations, Steep Learning Curve, Limited SQL Functionality |
Not Available
|
Not Available
|
| Review Summary |
Overall, Looker receives positive feedback for its user-friendly interface, robust data visualization capabilities, and ability to connect to a wide range of data sources. Praised for its ease of use and ability to empower business users with self-service analytics, Looker is seen as a valuable tool for data exploration and insights generation. However, some users mention challenges with performance and scalability, particularly when working with large datasets. Additionally, a few reviewers express concerns regarding the cost and complexity of implementation. |
Not Available
|
Not Available
|
| Read All User Reviews | Read All User Reviews | Read All User Reviews |
AI-Generated from the text of User Reviews
| Pricing Options |
|
|
|
|
Pricing Plans
Monthly Plans
Annual Plans
|
Looker Custom |
Free Free Premium $15.00 $15.00 per month Business Custom |
Personal edition Free Professional edition Perpetual $5,995.00 $5,995.00 One time payment Professional edition Annual Subscription $2,395.00 $2,395.00 per year |
|
View Detailed Pricing
|
View Detailed Pricing
|
View Detailed Pricing
|
|
|
|
||
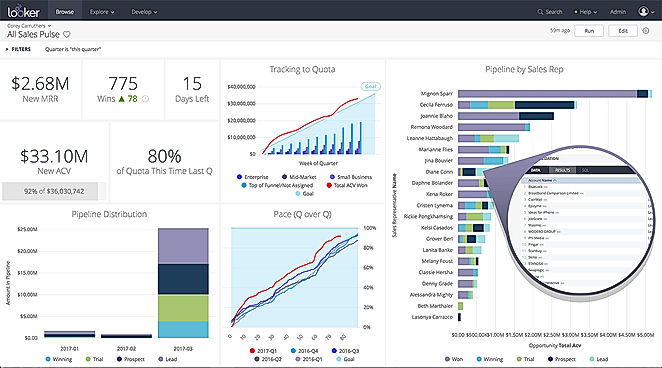
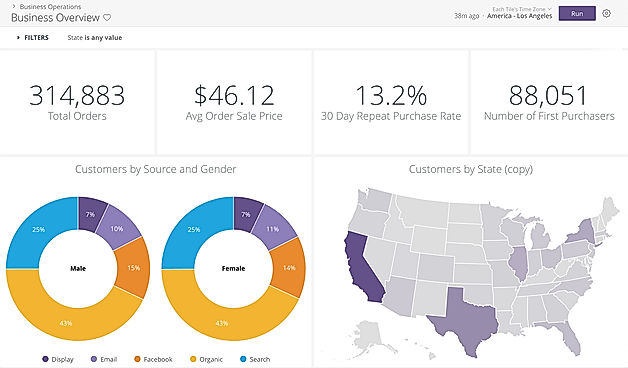
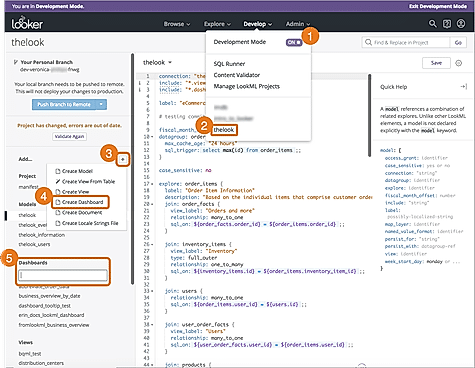
| Screenshots |
+ 2 More
|
Not Available | Not Available |
| Videos |

+ 2 More
|
+ 1 More
|

|
| Company Details | Located in: Santa Cruz, California | Located in: Kirkland, Washington | Located in: Pleasanton, USA |
| Contact Details |
+1‑831‑244‑0340 https://looker.com/ |
Not available https://columns.ai/ |
+1-925-924-9500 https://www.manageengine.com/analytics-plus/ |
| Social Media Handles |
|
|
|
Looking for the right SaaS
We can help you choose the best SaaS for your specific requirements. Our in-house experts will assist you with their hand-picked recommendations.
Want more customers?
Our experts will research about your product and list it on SaaSworthy for FREE.