Paylocity |
86% SW Score The SW Score ranks the products within a particular category on a variety of parameters, to provide a definite ranking system. Read more
View Details
|
82% SW Score The SW Score ranks the products within a particular category on a variety of parameters, to provide a definite ranking system. Read more
View Details
|
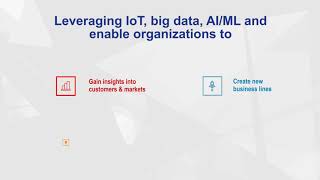
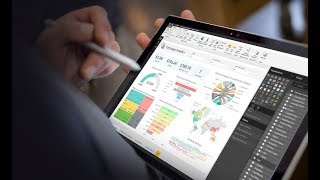
| Description | LatentView is a robust data and analytics software trusted by Fortune500 companies. It helps organisations provide better service to individual customers by moving up the analytics maturity curve via actionable insights, which ultimately leads to accurate data-driven decisions. LatentView’s business expertise covers a variety of metrics like big data capabilities, digital solution accelerators, analytics tools and social media predictive analytics. Also, Consulting services, data engineering, business analytics, supply chain analytics, risk and compliance analytics and digital solutions are amongst other vital services available within. Businesses related to industries like CGP and Retail, technology and BFSI find LatentView of great help. Further, technology market readers can trust the particular software with accurate machine learning models and other identified factors that help with subscriptions renewals. LatentView abides by top graded data privacy and safety policies, personal information collected from individual clients are used to deliver relevant content and periodic emails. None of the collected information is sold out to third parties, ever. Read more | Microsoft Power BI Desktop enables you to develop deep, actionable insights for a broad range of scenarios. Save time and make data prep easier with data modeling tools. Reclaim hours in your day using the self-service Power Query experience familiar to millions of Excel users. Dig deeper into data and find patterns you may have otherwise missed that lead to actionable insights. Use features like quick measures, grouping, forecasting, and clustering. Explore your data, automatically find patterns, understand what your data means, and predict future outcomes to drive business results. Read more |
| Pricing Options |
|
|
| SW Score & Breakdown |
86% SW Score The SW Score ranks the products within a particular category on a variety of parameters, to provide a definite ranking system. Read more
|
82% SW Score The SW Score ranks the products within a particular category on a variety of parameters, to provide a definite ranking system. Read more
|
| Total Features |
5 Features
|
5 Features
|
| Common Features for All |
Ad hoc Analysis
Ad hoc Query
Ad hoc Reports
Dashboard
Data Analysis
Strategic Planning
Trend Indicators
|
Ad hoc Analysis
Ad hoc Query
Ad hoc Reports
Dashboard
Data Analysis
Strategic Planning
Trend Indicators
|
| Organization Types Supported |
|
|
| Platforms Supported |
|
|
| Modes of Support |
|
|
| User Rating |
|
|
| Rating Distribution |
|
|
| Read All User Reviews | Read All User Reviews |
AI-Generated from the text of User Reviews
| Pricing Options |
|
|
|
Pricing Plans
Monthly Plans
Annual Plans
|
LatentView Custom |
Microsoft Power BI Desktop Free |
|
View Detailed Pricing
|
View Detailed Pricing
|
Get personalized recommendations from our experts on call
Trusted by more than 5 Million users across the globe.
Thank you for the enquiry. One of our software analysts will contact you soon.
| Screenshots | Not Available |

+ 2 More
|
| Videos |
+ 1 More
|
|
| Company Details | Located in: Princeton, New Jersey |
Not available |
| Contact Details |
+16093560662 |
Not available |
| Social Media Handles |
|
Not available |
Looking for the right SaaS
We can help you choose the best SaaS for your specific requirements. Our in-house experts will assist you with their hand-picked recommendations.
Want more customers?
Our experts will research about your product and list it on SaaSworthy for FREE.


