Splunk Cloud |
96% SW Score The SW Score ranks the products within a particular category on a variety of parameters, to provide a definite ranking system. Read more
View Details
|
90% SW Score The SW Score ranks the products within a particular category on a variety of parameters, to provide a definite ranking system. Read more
View Details
|
| Description | Grafana is software that assists companies to monitor everything from Prometheus & Graphite metrics, logs, applications, beehives, power plants, sourdough starters, and custom data sources. It makes metric visualization tools that are more accessible and easy to use across the entire company. Grafana cloud plan collects, analyzes, and alerts users on Graphite and Prometheus metrics and Loki logs on highly available, high-performance, and fully managed Grafana Cloud platforms. Users can get visibility into all data sources and metrics across their teams without jumping through multiple tabs and tools. The platform enables users to get massive query performance and high efficiency for their Prometheus metrics at any scale. Users can also access Grafana Enterprise, which includes access to enterprise plugins that take users' existing data sources and allow them to drop them right into Grafana. This will enable users to get the best out of their complicated and expensive monitoring solutions and databases by visualizing all the data more easily and effectively. Read more | Splunk Enterprise is a machine data management software that can turn data into answers with its intuitive machine learning-powered analytics tool. This software can help users harness the untapped value of data to optimize their organization and deliver excellent customer service all the time. Splunk can ingest data from various sources and turn them into meaningful business outcomes. It also uses different visualized metrics to boost search and monitor performances for a better result. Powered by Artificial Intelligence, the software renders much attention to the organization’s IT, security and business arenas. Finally, when the software is connected, it allows everyone in the organization to see insights and get a quick glimpse of the business anytime. With special machine learning and performance capabilities, Splunk Enterprise can deliver a better experience to customers. It can even assist the support and retail teams to have real-time visibility and understand their system and service statistics properly. Read more | Prometheus is a metrics-based monitoring system that is designed to track an organisation's overall health, performance and behaviour. It gathers, organises and stores real-time metrics besides delivering intuitive alerts in no time. The software uses dimensional data modelling, flexible query language, modern alerting techniques and an effective time-series database to provide elegant monitoring solutions. With a cleverly designed interface and futuristic features, Prometheus delivers excellent insights derived from a variety of metrics. By implementing a highly dimensional data tool and key-value pairs, it converts data into meaningful insights. This efficient monitoring solution enables users to slice and dice collected time series data through PromQL and generate informative graphs, tables, and alerts as per convenience. Prometheus also comes loaded with a variety of sophisticated templates facilitating seamless data visualisation and integrated Grafana functionality. Furthermore, it provides an efficient storage facility for time series besides working on a simple yet reliable server. The platform’s alerting approach is rooted in PromQL and is flexibly designed. Lastly, this open-source software is completely community-driven and highly secure as well. Read more |
| Pricing Options |
|
|
|
| SW Score & Breakdown |
96% SW Score The SW Score ranks the products within a particular category on a variety of parameters, to provide a definite ranking system. Read more
|
90% SW Score The SW Score ranks the products within a particular category on a variety of parameters, to provide a definite ranking system. Read more
|
|
| SaaSworthy Awards | # 5 Fastest Growing # 2 Most Popular |
Not Available
|
Not Available
|
| Organization Types Supported |
|
|
|
| Platforms Supported |
|
|
|
| Modes of Support |
|
|
|
| API Support |
|
|
|
| User Rating |
|
|
|
| Rating Distribution |
|
|
|
| User Sentiments |
Easy to Use Interface, Extensive Customization Options, Powerful Visualization Capabilities, Wide Range of Data Source Integrations Steep Learning Curve, Slow Loading Times, Limited Alerting Functionality, Complex Querying Language |
Powerful Search Capabilities, Extensive Integrations, Customizable Dashboards, Real-time Monitoring and Alerting High Cost, Steep Learning Curve, Resource Intensive, Occasional Performance Issues |
Easy to Install and Configure, Extensive Integrations, Customizable Metrics, Efficient Monitoring Complex Query Language (PromQL), Limited Built-in Visualization, Steep Learning Curve, Lack of Detailed Documentation |
| Review Summary |
Grafana is widely praised for its powerful visualization capabilities, allowing users to create custom dashboards that provide insightful views of data from a variety of sources. Users appreciate its flexibility, extensive plugin library, and ease of integration with various monitoring tools. However, some users find the initial setup and configuration process complex, and point to limitations in its alerting capabilities. Despite these drawbacks, Grafana remains a popular choice for monitoring and analysis, particularly for those seeking a customizable open-source solution. |
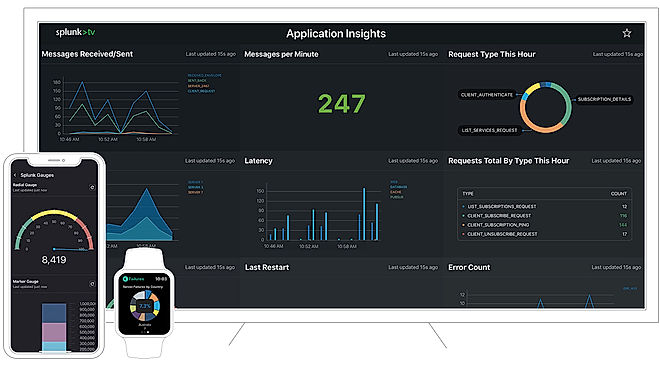
Splunk Enterprise users generally find the product to be a powerful and versatile tool for collecting, analyzing, and visualizing machine data. It is praised for its ability to handle large volumes of data, its customizable dashboards and reports, and its wide range of integrations. However, some users have reported challenges with the product's complexity, the learning curve associated with it, and its cost. Additionally, some users have expressed concerns about the product's potential performance issues and its lack of certain features that may be important for specific use cases. |
Users praise Prometheus for its robust monitoring capabilities, highlighting its user-friendly interface, extensive metrics library, and flexible alerting system. They appreciate its ability to collect and visualize data from diverse sources, enabling comprehensive monitoring of IT infrastructure and applications. Additionally, users commend Prometheus's open-source nature, strong community support, and active development, ensuring continuous improvements and feature enhancements. While some users mention occasional performance issues or a learning curve for new users, the overall sentiment is overwhelmingly positive, reflecting Prometheus's effectiveness as a monitoring solution. |
| Read All User Reviews | Read All User Reviews | Read All User Reviews |
AI-Generated from the text of User Reviews
| Pricing Options |
|
|
|
|
Pricing Plans
Monthly Plans
Annual Plans
|
Free Forever Free Pro $19.00 $19.00 per month Advanced $299.00 $299.00 per month Enterprise Custom |
Splunk Enterprise Custom |
Prometheus Custom |
|
View Detailed Pricing
|
View Detailed Pricing
|
View Detailed Pricing
|
Get personalized recommendations from our experts on call
Trusted by more than 5 Million users across the globe.
Thank you for the enquiry. One of our software analysts will contact you soon.
| Screenshots |

+ 3 More
|
|

+ 3 More
|
| Videos |

|

+ 2 More
|
Not Available |
| Company Details | Located in: New York, New York Founded in: 2014 | Located in: San Francisco, California |
Not available |
| Contact Details |
Not available |
+1 415-848-8400 https://www.splunk.com/en_us/software/splunk-enterprise.html |
Not available |
| Social Media Handles |
|
|
|
Looking for the right SaaS
We can help you choose the best SaaS for your specific requirements. Our in-house experts will assist you with their hand-picked recommendations.
Want more customers?
Our experts will research about your product and list it on SaaSworthy for FREE.