Nagios XI |
95% SW Score The SW Score ranks the products within a particular category on a variety of parameters, to provide a definite ranking system. Read more
Visit Website
|
79% SW Score The SW Score ranks the products within a particular category on a variety of parameters, to provide a definite ranking system. Read more
Visit Website
|
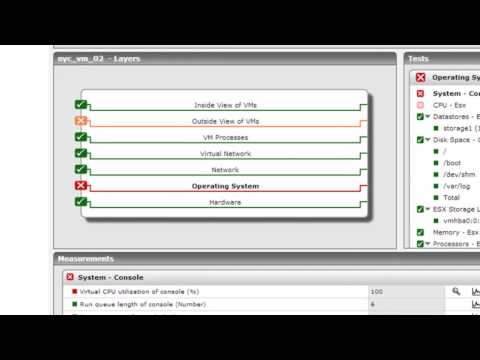
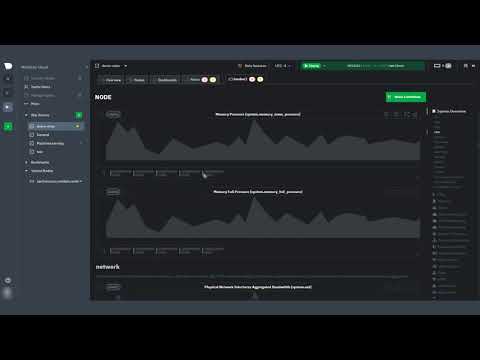
| Description | This application performance management is a leader in the application performance and the IT sector. Established in 2001, eG Enterprise is currently monitoring services of over 180 applications including Java, SharePoint, Office 365 and more. Thousands of IT industries are reliant on this software to solve challenges like slow apps, hardware faults, code-level errors, and capacity issues. eG Enterprise helps developers and application managers to detect the root causes of issues and troubleshoot faster. As users access the application, this software monitors their digital experience and lets them know whenever their user experience gets affected. Reasons for code errors can also be identified and slow remote calls by using distributed transaction tracing and receive code-level visibility into applications. Users can also construct topology maps and auto-discover dependencies between underlying IT components such as cloud, virtualisation, container, network, and applications. Use machine learning and built-in correlative intelligence to isolate the root cause of slowdowns in performance. Read more | Netdata is a Linux-based software that helps to diagnose anomalies and slowdowns in your system with insightful analysis, metrics and engaging visualizations. Get a live demo of your system’s performance from various cities in the world. It covers an array of fields where data is provided like RAM, CPU, IP Address, network performance across various bandwidths, softnets, entropy, and disks. It enables you to see monitoring, Nginx, IP Networking and even monitors net data along with programming in MySQL. Netdata can be installed on any platform and detects hundreds of metrics in real-time through fully functional visualizations. It can monitor your health in real-time and moreover it is flexible and easy to integrate with hundreds of metrics. This app allows users to detect low-latency visualizations to detect any possible anomalies after comparison with metrics. The dedicated database of Netdata doesn't require resources to detect. It just collects, stores and processes data to let you visualize in low-latency and high-power resolutions followed by streaming of data and final archive. Read more |
| Pricing Options |
|
|
| SW Score & Breakdown |
95% SW Score The SW Score ranks the products within a particular category on a variety of parameters, to provide a definite ranking system. Read more
|
79% SW Score The SW Score ranks the products within a particular category on a variety of parameters, to provide a definite ranking system. Read more
|
| Total Features |
11 Features
|
5 Features
|
| Common Features for All |
API Monitoring
Alerts (Notifications)
Application Performance Metrics
Dashboard
Event Logs
Event-based Notification
Mail Server Monitoring
Page Speed Monitoring
Real-user Monitoring
Synthetic Transaction Monitoring
Web Defacement Monitoring
|
API Monitoring
Alerts (Notifications)
Application Performance Metrics
Dashboard
Event Logs
Event-based Notification
Mail Server Monitoring
Page Speed Monitoring
Real-user Monitoring
Synthetic Transaction Monitoring
Web Defacement Monitoring
|
| Organization Types Supported |
|
|
| Platforms Supported |
|
|
| Modes of Support |
|
|
| API Support |
|
|
| User Rating |
|
Not Available
|
| Rating Distribution |
|
Not Available
|
| Read All User Reviews |
AI-Generated from the text of User Reviews
| Pricing Options |
|
|
|
Pricing Plans
Monthly Plans
Annual Plans
|
Easy Evaluation (Cloud Deployed) Free Perpetual License (On-Premise) Custom Subscription (On-Premise) $300.00 $300.00 per month SaaS (Cloud Deployed) Custom Audit Service (On-Premise or Cloud) Custom |
Agent OSS Free Community Free Pro $3.00 $3.00 per month Business $4.00 $4.00 per month Enterprise Custom |
|
View Detailed Pricing
|
View Detailed Pricing
|
|
ManageEngine Applications Manager
4.8 Based on 75 Ratings eG Enterprise Vs ManageEngine Applications Manager |
|
|
| Screenshots | Not Available |

+ 2 More
|
| Videos |
+ 2 More
|
+ 2 More
|
| Company Details | Located in: Iselin, New Jersey Founded in: 2001 | Located in: Redwood City, California Founded in: 2018 |
| Contact Details |
+1 866 526 6700 https://www.eginnovations.com/ |
Not available https://www.netdata.cloud/ |
| Social Media Handles |
|
|
Looking for the right SaaS
We can help you choose the best SaaS for your specific requirements. Our in-house experts will assist you with their hand-picked recommendations.
Want more customers?
Our experts will research about your product and list it on SaaSworthy for FREE.


