|
|
96% SW Score The SW Score ranks the products within a particular category on a variety of parameters, to provide a definite ranking system. Read more
Start Free Trial
|
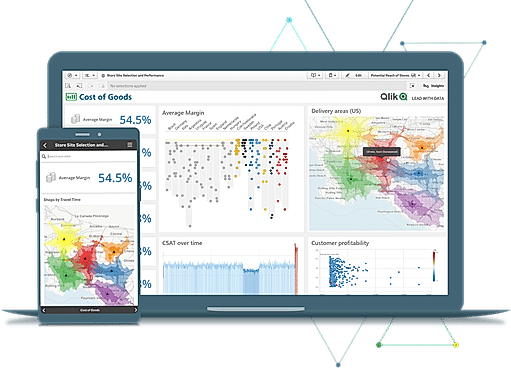
| Description | Qlik Sense is a smart analytics tool to generate personalized reports and dashboards instantly. It allows easy navigation through a huge amount of data and collects detailed information. It provides smart visualizations and can be integrated with the QIX engine which makes it more interactive. Also, it has a smart data load feature which enhances the ability to complete common tasks quickly with a click and go approach. It supports customization to meet unique business requirements. Along with this, it supports robust integration that can be used to transform and combine multiple data sources to provide smooth data analysis. Read more | Chartio enables companies to combine data sources from multiple systems and databases together without storing a copy of your data. Chartio visualizations can easily be embedded into webpages, shared in Slack channels, emailed as PDF reports, and exported as images or SVGs. Think of Chartio as your strategic partner, with extensive documentation, live training, and experienced Data Advisors committed to helping you get the most out of your data. Rearrange and resize your charts to get your favorite layout, and add or delete charts at any time. Read more |
| Pricing Options |
|
|
| SW Score & Breakdown |
96% SW Score The SW Score ranks the products within a particular category on a variety of parameters, to provide a definite ranking system. Read more
|
|
| SaaSworthy Awards | # 2 Highly Rated # 5 Fastest Growing |
Not Available
|
| Total Features |
10 Features
|
10 Features
|
| Common Features for All |
Ad hoc Analysis
Ad hoc Query
Ad hoc Reports
Benchmarking
Dashboard
Data Analysis
Key Performance Indicators
Profitability Analysis
Strategic Planning
Trend Indicators
|
Ad hoc Analysis
Ad hoc Query
Ad hoc Reports
Benchmarking
Dashboard
Data Analysis
Key Performance Indicators
Profitability Analysis
Strategic Planning
Trend Indicators
|
| Organization Types Supported |
|
|
| Platforms Supported |
|
|
| Modes of Support |
|
|
| API Support |
|
|
| User Rating |
|
|
| Rating Distribution |
|
|
| User Sentiments |
Fast Data Processing, Interactive Dashboards, Intuitive User Interface, Extensive Integrations Sluggish Performance with Large Datasets, Limited Customization Options, Complex Scripting Language, Poor Mobile Experience |
Not Available
|
| Review Summary |
Overall, users find the product easy to use and visually appealing, praising its intuitive interface and customizable dashboards. They commend its data visualization capabilities, enabling them to create interactive and visually appealing reports. Additionally, users appreciate the drag-and-drop functionality and the wide range of available connectors, making it easy to integrate with other systems. However, some users report performance issues, particularly with large datasets. They also mention the need for improved customer support and documentation, as well as more advanced features for data analysis and machine learning. |
Not Available
|
| Read All User Reviews | Read All User Reviews |
AI-Generated from the text of User Reviews
| Pricing Options |
|
|
|
Pricing Plans
Monthly Plans
Annual Plans
|
Qlik Sense $20.00 $20.00 per user / month |
Startup $40.00 $40.00 per user / month Growth $60.00 $60.00 per user / month Premium Custom |
|
View Detailed Pricing
|
|
|
|
|
| Screenshots |
|

+ 3 More
|
| Videos |

+ 2 More
|

+ 2 More
|
| Company Details | Located in: King of Prussia, Pennsylvania | Located in: San Francisco, California |
| Contact Details |
+1 888-828-9768 https://www.qlik.com/us/products/qlik-sense |
Not available https://chartio.com/ |
| Social Media Handles |
|
|
Looking for the right SaaS
We can help you choose the best SaaS for your specific requirements. Our in-house experts will assist you with their hand-picked recommendations.
Want more customers?
Our experts will research about your product and list it on SaaSworthy for FREE.