|
96% SW Score The SW Score ranks the products within a particular category on a variety of parameters, to provide a definite ranking system. Read more
View Details
|
90% SW Score The SW Score ranks the products within a particular category on a variety of parameters, to provide a definite ranking system. Read more
View Details
|
91% SW Score The SW Score ranks the products within a particular category on a variety of parameters, to provide a definite ranking system. Read more
View Details
|
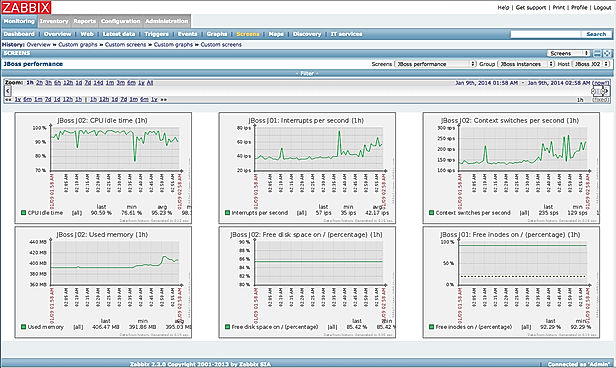
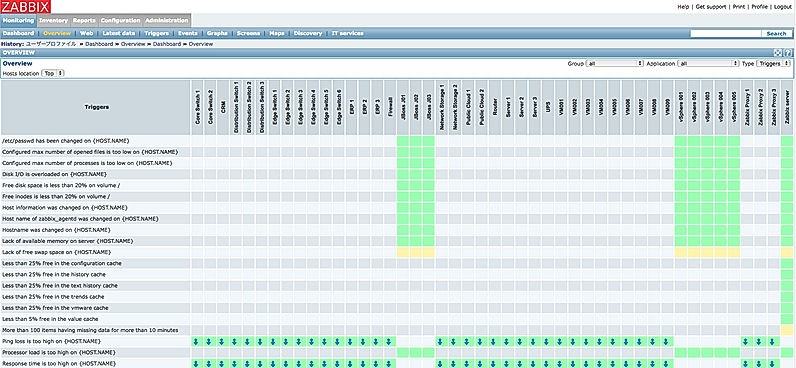
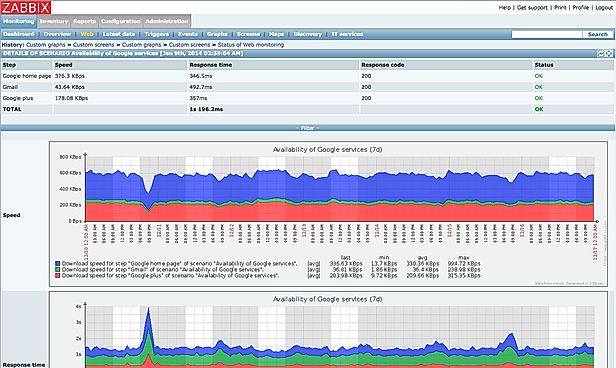
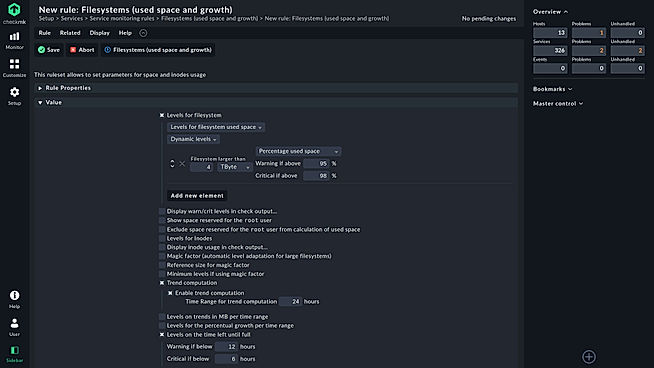
| Description | Zabbix is a network monitoring software that allows real-time network performance monitoring and management.You can monitor internet usage, bandwidth, IP address, uptime, server etc.The software comes designed with real time analytics, diagnostic tools and web traffic reporting.It helps in resource management as well.The platform is highly scalable. Zabbix Monitoring Solution notifies you if the power supply is critical, device temperature is excessively high/low, low free disk space etc.The tool is optimized for better performance and allows 3rd party software integration. It further includes features like security authentication, templating, autodiscovery etc. Read more | Prometheus is a metrics-based monitoring system that is designed to track an organisation's overall health, performance and behaviour. It gathers, organises and stores real-time metrics besides delivering intuitive alerts in no time. The software uses dimensional data modelling, flexible query language, modern alerting techniques and an effective time-series database to provide elegant monitoring solutions. With a cleverly designed interface and futuristic features, Prometheus delivers excellent insights derived from a variety of metrics. By implementing a highly dimensional data tool and key-value pairs, it converts data into meaningful insights. This efficient monitoring solution enables users to slice and dice collected time series data through PromQL and generate informative graphs, tables, and alerts as per convenience. Prometheus also comes loaded with a variety of sophisticated templates facilitating seamless data visualisation and integrated Grafana functionality. Furthermore, it provides an efficient storage facility for time series besides working on a simple yet reliable server. The platform’s alerting approach is rooted in PromQL and is flexibly designed. Lastly, this open-source software is completely community-driven and highly secure as well. Read more | Companies depend on Pandora FMS to get their monitoring needs taken care of in a simple and secure way. The particular tool is designed by Artica ST and comes loaded with a full-fledged ecosystem inclusive of facilities like personalised face to face training, technical support, distance training, certified international partners, community version developers and an intuitive plugin library alike. Further, it is also capable of integrating information islands of SAP, servers, Mainframe, IP telephony, applications or communications within a unified monitoring umbrella. The platform is absolutely secure, compatible with stringent security standards like SO 27001 and PCI/DSS. Its integrated list of secure architecture elements comes loaded with metrics like delegated authentication system, safe traffic through certificates and encryptions, double authentication system, internal audit system, password policy, credential storages, rootless installation, agent communication based safe architecture and integrated backup. Pandora FMS is certified under ISO/IEC 27001:2013 besides complying with National Security Scheme. Read more | Checkmk is Best-in-class infrastructure & application monitoring Helping you stay up and running from simple to the most complex environments. And its a leading IT monitoring system for on-premise and cloud infrastructure and application monitoring that enables admins, IT managers, and DevOps teams to identify and resolve issues across their entire IT infrastructure quickly. It is suitable for all size of organizations. Read more |
| Pricing Options |
|
|
|
|
| SW Score & Breakdown |
96% SW Score The SW Score ranks the products within a particular category on a variety of parameters, to provide a definite ranking system. Read more
|
|
90% SW Score The SW Score ranks the products within a particular category on a variety of parameters, to provide a definite ranking system. Read more
|
91% SW Score The SW Score ranks the products within a particular category on a variety of parameters, to provide a definite ranking system. Read more
|
| Organization Types Supported |
|
|
|
|
| Platforms Supported |
|
|
|
|
| Modes of Support |
|
|
|
|
| API Support |
|
|
|
|
| User Rating |
|
|
|
|
| Rating Distribution |
|
|
|
|
| User Sentiments |
Customizable Monitoring, Comprehensive Monitoring Capabilities, Open Source, Real-Time Alerting Steep Learning Curve, Outdated User Interface, Complicated Setup Process, Limited Reporting Functionality |
Easy to Install and Configure, Extensive Integrations, Customizable Metrics, Efficient Monitoring Complex Query Language (PromQL), Limited Built-in Visualization, Steep Learning Curve, Lack of Detailed Documentation |
Not Available
|
Not Available
|
| Review Summary |
Overall, users find the software easy to use, praising its intuitive interface, user-friendly dashboards, and customizable features. It is lauded for its comprehensive monitoring capabilities, including network monitoring, server monitoring, and application monitoring, with users appreciating its ability to detect and alert on issues promptly. However, some users have reported occasional bugs and performance issues, and a few have expressed concerns about the complexity of the software and the need for specialized skills for full utilization. |
Users praise Prometheus for its robust monitoring capabilities, highlighting its user-friendly interface, extensive metrics library, and flexible alerting system. They appreciate its ability to collect and visualize data from diverse sources, enabling comprehensive monitoring of IT infrastructure and applications. Additionally, users commend Prometheus's open-source nature, strong community support, and active development, ensuring continuous improvements and feature enhancements. While some users mention occasional performance issues or a learning curve for new users, the overall sentiment is overwhelmingly positive, reflecting Prometheus's effectiveness as a monitoring solution. |
Not Available
|
Not Available
|
| Read All User Reviews | Read All User Reviews | Read All User Reviews | Read All User Reviews |
AI-Generated from the text of User Reviews
| Pricing Options |
|
|
|
|
|
Pricing Plans
Monthly Plans
Annual Plans
|
Zabbix Free |
Prometheus Custom |
Lite Others Enterprise Custom Corporate Custom |
Free Free Plan 1 $150.00 $150.00 per month Plan 2 $250.00 $250.00 per month Plan 3 $375.00 $375.00 per month Plan 4 $600.00 $600.00 per month Plan 5 $750.00 $750.00 per month Enterprise Custom |
|
View Detailed Pricing
|
View Detailed Pricing
|
View Detailed Pricing
|
View Detailed Pricing
|
|
SolarWinds Network Performance Monitor
4.4 Based on 448 Ratings Zabbix Vs SolarWinds Network Performance Monitor |
Splunk Enterprise
4.3 Based on 1319 Ratings
New Relic Alerts
4.5 Based on 14 Ratings |
|
SolarWinds Network Performance Monitor
4.4 Based on 448 Ratings Checkmk Vs SolarWinds Network Performance Monitor |
|
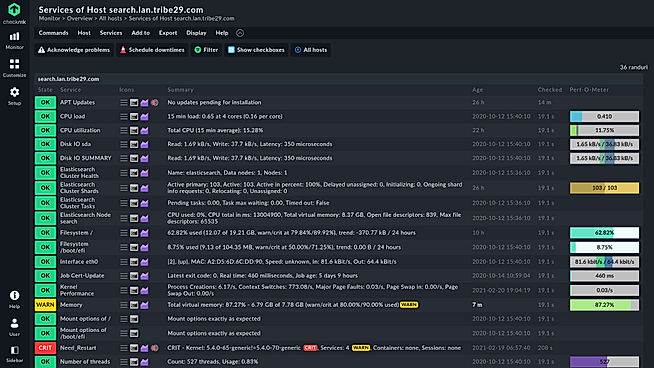
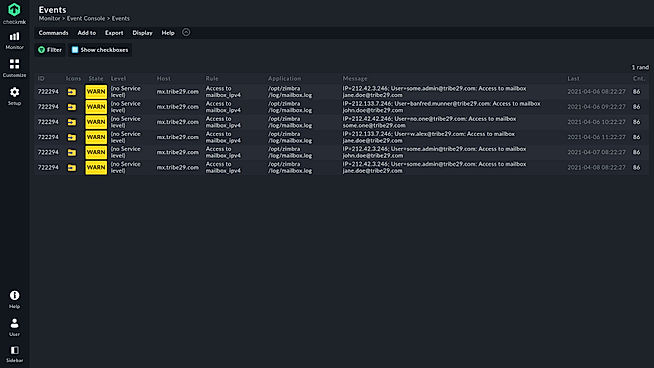
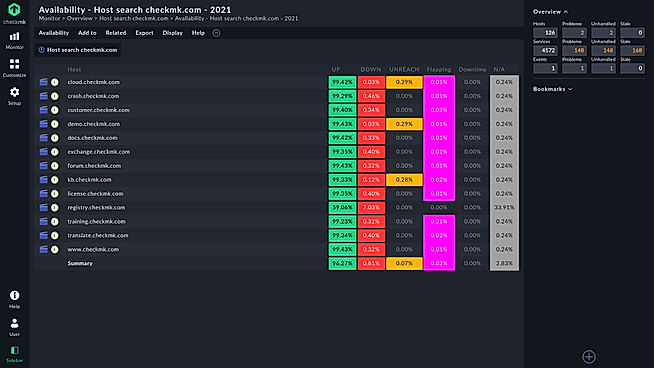
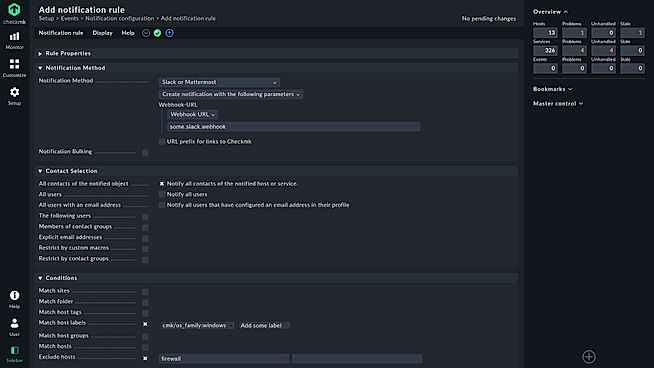
| Screenshots |
+ 3 More
|

+ 3 More
|
Not Available |
+ 4 More
|
| Videos |

|
Not Available |

|

+ 2 More
|
| Company Details | Located in: Riga, Latvia |
Not available |
Located in: Madrid, Spain | Located in: Munich, Germany |
| Contact Details |
+371 6778-4742 https://www.zabbix.com/network_monitoring |
Not available https://prometheus.io/ |
+34-91-559-72-22 https://pandorafms.com/pandora-fms-enterprise/ |
+ 498912085616 https://checkmk.com/ |
| Social Media Handles |
|
|
|
|
Looking for the right SaaS
We can help you choose the best SaaS for your specific requirements. Our in-house experts will assist you with their hand-picked recommendations.
Want more customers?
Our experts will research about your product and list it on SaaSworthy for FREE.