Sisense |
91% SW Score The SW Score ranks the products within a particular category on a variety of parameters, to provide a definite ranking system. Read more
Start Free Trial
|
81% SW Score The SW Score ranks the products within a particular category on a variety of parameters, to provide a definite ranking system. Read more
Start Free Trial
|
Sponsored
85% SW Score The SW Score ranks the products within a particular category on a variety of parameters, to provide a definite ranking system. Read more ManageEngine Analytics Plus
Visit Website
|
| Description | SAP Business Objects BI is a business analytics measuring software that helps to discover and share insights easily on its platform. This helps users to make better decisions concerning their business. SAP Business Objectives BI provides a flexible architectural platform to its users, helping them to grow their business from a small enterprise to a large company. It also offers on-premise deployment, increased user autonomy and real-time business intelligence to its users. SAP Business Objects BI supports the changing needs of its users’ business by providing them with an entirely scalable platform and the latest business technologies. With the help of the extensive suite of business intelligence provided by the software, users can convert the essential data related to their business into useful information. The easy-to-use BI tools of the software enable users to understand the latest business trends in the market. The office integration feature of the software includes intuitive tools with which users can filter, identify and manipulate trends along with outliers from Microsoft Excel. Finally, the software also allows users to build attractive BI visualizations and Dashboard in order to highlight unique insights related to their business. Read more | Tableau is a visual analytics platform. It is transforming the way people use data to solve problems—empowering people and organizations to make the most of their data. this is the broadest and deepest data and analytics platform. With Tableau, you can choose from on-premises or public cloud and configure servers, scale hardware capacity according to your requirements or manage software upgrades. You can connect to any data and turbocharge teamwork by discovering,collaborating, sharing, and exploring data from your mobile phone, tablet, or computer. This way you can build and scale mission-critical analytics while maintaining control with Tableau Server Management, which offers increased scalability, improved efficiency, and enhanced security.You can deliver trusted data with centralized governance, visibility, and control which ensures your data is in the right hands with easy, automated authentication and permissions management.To integrate data insights where you work- with embedded analytics, you can seamlessly embed data and insights into your products and applications which empower your users and customers with data-driven insights. Read more | Make your data more useful than ever before with advanced analytics and feature-rich dashboards from ManageEngine Analytics Plus. You can connect to any data source and upload files, spreadsheets, URL feeds and a lot more with absolute ease. Build complex reports on its easy-to-use interface and represent your data on a variety of charts, widgets and tabular views. You can also combine multiple reports and view it on a single dashboard and use its powerful formula engine to derive metrics from complex data and reports. Integrate with ManageEngine’s ITSM, support and IT support suite and get a better insight into your helpdesk and customer support operations. Read more |
| Pricing Options |
|
|
|
| SW Score & Breakdown |
91% SW Score The SW Score ranks the products within a particular category on a variety of parameters, to provide a definite ranking system. Read more
|
81% SW Score The SW Score ranks the products within a particular category on a variety of parameters, to provide a definite ranking system. Read more
|
85% SW Score The SW Score ranks the products within a particular category on a variety of parameters, to provide a definite ranking system. Read more
|
| SaaSworthy Awards | # 5 Highly Rated |
Not Available
|
Not Available
|
| Total Features |
10 Features
|
3 Features
|
7 Features
|
| Common Features for All |
Ad hoc Analysis
Ad hoc Query
Ad hoc Reports
Benchmarking
Dashboard
Data Analysis
Key Performance Indicators
Profitability Analysis
Strategic Planning
Trend Indicators
|
Ad hoc Analysis
Ad hoc Query
Ad hoc Reports
Benchmarking
Dashboard
Data Analysis
Key Performance Indicators
Profitability Analysis
Strategic Planning
Trend Indicators
|
Ad hoc Analysis
Ad hoc Query
Ad hoc Reports
Benchmarking
Dashboard
Data Analysis
Key Performance Indicators
Profitability Analysis
Strategic Planning
Trend Indicators
|
| Organization Types Supported |
|
|
|
| Platforms Supported |
|
|
|
| Modes of Support |
|
|
|
| API Support |
|
|
|
| User Rating |
|
|
|
| Rating Distribution |
|
|
|
| User Sentiments |
Powerful Reporting Capabilities, Extensive Data Source Compatibility, Automated Report Scheduling and Distribution, Customizable Reports Steep Learning Curve, Outdated User Interface, Slow Performance with Large Datasets, Complex System Configuration |
Not Available
|
Not Available
|
| Review Summary |
Overall, SAP BusinessObjects is a comprehensive business intelligence (BI) platform that empowers users with robust data analysis, visualization, and reporting capabilities. Many reviewers praise its user-friendly interface, in-depth data exploration features, and seamless integration with other SAP applications. However, some users have expressed concerns about its complexity, occasional performance issues, and the need for extensive training. Despite these drawbacks, SAP BusinessObjects remains a powerful tool for businesses seeking advanced data-driven insights. |
Not Available
|
Not Available
|
| Read All User Reviews | Read All User Reviews | Read All User Reviews |
AI-Generated from the text of User Reviews
| Pricing Options |
|
|
|
|
Pricing Plans
Monthly Plans
Annual Plans
|
SAP BusinessObjects BI Custom |
Tableau Viewer $12.00 $12.00 per user / month Tableau Explorer $35.00 $35.00 per user / month Tableau Creator $70.00 $70.00 per user / month |
Personal edition Free Professional edition Perpetual $5,995.00 $5,995.00 One time payment Professional edition Annual Subscription $2,395.00 $2,395.00 per year |
|
View Detailed Pricing
|
View Detailed Pricing
|
View Detailed Pricing
|
|
SAS Business Intelligence
4.4 Based on 252 Ratings SAP BusinessObjects BI Vs SAS Business Intelligence
Microsoft Power BI Desktop
4.8 Based on 25 Ratings SAP BusinessObjects BI Vs Microsoft Power BI Desktop |
Tableau CRM
4.4 Based on 360 Ratings
Tableau Prep
4.5 Based on 31 Ratings |
||
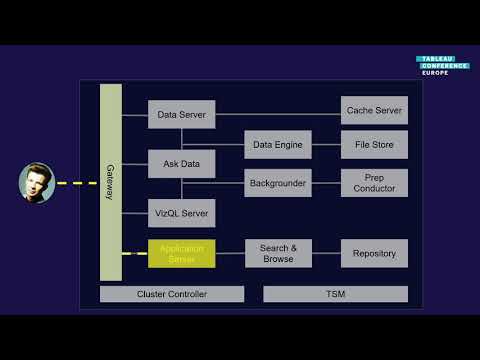
| Screenshots |

+ 3 More
|

+ 4 More
|
Not Available |
| Videos |
+ 1 More
|
+ 1 More
|

|
| Company Details | Located in: Walldorf, Germany | Located in: Seattle, Washington | Located in: Pleasanton, USA |
| Contact Details |
+1-800-872-1727 https://www.sap.com/products/bi-platform.html |
+1 206-633-3400 https://www.tableau.com/products/server |
+1-925-924-9500 https://www.manageengine.com/analytics-plus/ |
| Social Media Handles |
|
|
|
Looking for the right SaaS
We can help you choose the best SaaS for your specific requirements. Our in-house experts will assist you with their hand-picked recommendations.
Want more customers?
Our experts will research about your product and list it on SaaSworthy for FREE.


