Sisense |
95% SW Score The SW Score ranks the products within a particular category on a variety of parameters, to provide a definite ranking system. Read more
Start Free Trial
|
80% SW Score The SW Score ranks the products within a particular category on a variety of parameters, to provide a definite ranking system. Read more
Start Free Trial
|
Sponsored
85% SW Score The SW Score ranks the products within a particular category on a variety of parameters, to provide a definite ranking system. Read more ManageEngine Analytics Plus
Visit Website
|
| Description | Grow is a full stack BI (Business Intelligence) Software with no code policy that assists the businesses in making data-driven choices backed by detailed insights and analytics. The platform makes it simple to convert, cleanse, and analyze data from a variety of sources so that sophisticated analytics and dashboards can be generated at a single place. With Grow, native connections can be linked to the most widely used systems, databases, and CRMs to integrate data easily via APIs that continuously import and update data, ensuring that your KPIs are up-to-date and trustworthy while making key business choices. Grow's connections with OneDrive, Google Sheets, Excel/CSV Upload, Google Docs, Dropbox, Smartsheets, Airtable and Amazon S3 gives versatility by allowing data imports from files. Users can import ad data from Google, Twitter, Facebook, LinkedIn and Microsoft to see how they can make the most of their marketing money. Users can additionally import data from their digital analytics systems, such as Google Analytics, Google Search Console, or HubSpot to learn how visitors interact with their site or platform. Read more | IBM Watson Knowledge Catalog can be used to activate AI relevant business-ready data combined with intelligent cataloguing and interactive policy management. Companies can utilise the particular to generate a common foundation of business governance glossary, besides customising individual needs to facilitate better understanding. They also get to deliver both trusted and quality data based on ML and automation alike. Further, role-based access control, active policy monitoring techniques and sensitive data masking protocols help users protect data and promote compliance accordingly. Intelligent recommendations offered by IBM Watson and other related platforms facilitates the advanced discovery of important assets as per need. Also, self-service insights available over dedicated dashboards, help users to consume and transform data accordingly, besides sharing the particulars with peers or third party analytical tools for accurate analysis. Other essential facilities loaded within are global search, automated governance, end-to-end cataloguing, operationalised quality and accelerated collaboration. Read more | Make your data more useful than ever before with advanced analytics and feature-rich dashboards from ManageEngine Analytics Plus. You can connect to any data source and upload files, spreadsheets, URL feeds and a lot more with absolute ease. Build complex reports on its easy-to-use interface and represent your data on a variety of charts, widgets and tabular views. You can also combine multiple reports and view it on a single dashboard and use its powerful formula engine to derive metrics from complex data and reports. Integrate with ManageEngine’s ITSM, support and IT support suite and get a better insight into your helpdesk and customer support operations. Read more |
| Pricing Options |
|
|
|
| SW Score & Breakdown |
95% SW Score The SW Score ranks the products within a particular category on a variety of parameters, to provide a definite ranking system. Read more
|
80% SW Score The SW Score ranks the products within a particular category on a variety of parameters, to provide a definite ranking system. Read more
|
85% SW Score The SW Score ranks the products within a particular category on a variety of parameters, to provide a definite ranking system. Read more
|
| SaaSworthy Awards | # 8 Highly Rated # 7 Most Popular |
Not Available
|
Not Available
|
| Total Features |
10 Features
|
4 Features
|
7 Features
|
| Common Features for All |
Ad hoc Analysis
Ad hoc Query
Ad hoc Reports
Benchmarking
Dashboard
Data Analysis
Key Performance Indicators
Profitability Analysis
Strategic Planning
Trend Indicators
|
Ad hoc Analysis
Ad hoc Query
Ad hoc Reports
Benchmarking
Dashboard
Data Analysis
Key Performance Indicators
Profitability Analysis
Strategic Planning
Trend Indicators
|
Ad hoc Analysis
Ad hoc Query
Ad hoc Reports
Benchmarking
Dashboard
Data Analysis
Key Performance Indicators
Profitability Analysis
Strategic Planning
Trend Indicators
|
| Organization Types Supported |
|
|
|
| Platforms Supported |
|
|
|
| Modes of Support |
|
|
|
| API Support |
|
|
|
| User Rating |
|
|
|
| Rating Distribution |
|
|
|
| User Sentiments |
Extensive Integrations, User Friendly Interface, Data Visualization Capabilities, Excellent Customer Support Slow Performance, Occasional Bugs, Limited Customization Options, Mobile App Issues |
Not Available
|
Not Available
|
| Review Summary |
Grow, a financial reporting and budgeting tool, receives mixed reviews from users. While some praise its user-friendly interface, customization options, and robust reporting capabilities, others criticize its occasional bugs, limited customer support, and lack of certain advanced features. Its pricing is generally considered affordable, but some reviewers note that the cost can increase as businesses scale. Overall, Grow appears to be a solid choice for small businesses seeking a user-friendly and customizable financial reporting solution, but companies with more complex needs may find it lacking in certain areas. |
Not Available
|
Not Available
|
| Read All User Reviews | Read All User Reviews | Read All User Reviews |
AI-Generated from the text of User Reviews
| Pricing Options |
|
|
|
|
Pricing Plans
Monthly Plans
Annual Plans
|
Grow.com Custom |
Lite Free Standard $300.00 $300.00 per instance Professional $7,000.00 $7,000.00 per instance |
Personal edition Free Professional edition Perpetual $5,995.00 $5,995.00 One time payment Professional edition Annual Subscription $2,395.00 $2,395.00 per year |
|
View Detailed Pricing
|
View Detailed Pricing
|
View Detailed Pricing
|
|
|
IBM Watson Studio
4.3 Based on 161 Ratings
IBM StoredIQ Suite
5 Based on 1 Ratings
IBM Data Refinery
5 Based on 1 Ratings
IBM Watson Machine Learning Accelerator
5 Based on 1 Ratings |
||
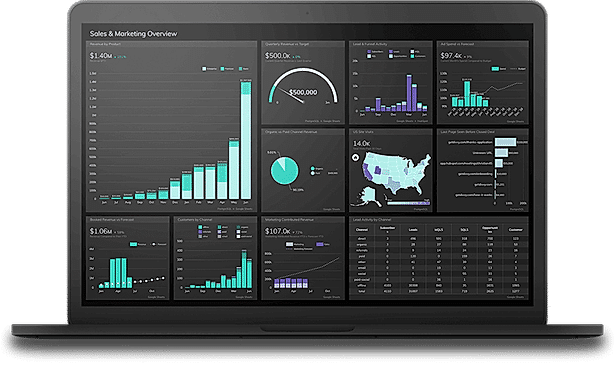
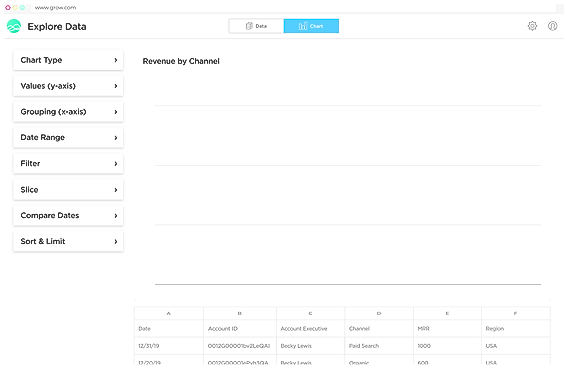
| Screenshots |

+ 1 More
|

|
Not Available |
| Videos |
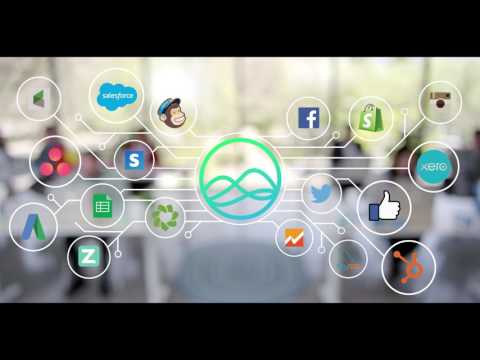
+ 2 More
|

+ 1 More
|

|
| Company Details | Located in: Lehi, UT Founded in: 2014 | Located in: Armonk, New York | Located in: Pleasanton, USA |
| Contact Details |
1-415-614-4474 https://www.grow.com/ |
Not available https://www.ibm.com/cloud/watson-knowledge-catalog |
+1-925-924-9500 https://www.manageengine.com/analytics-plus/ |
| Social Media Handles |
|
Not available |
|
Looking for the right SaaS
We can help you choose the best SaaS for your specific requirements. Our in-house experts will assist you with their hand-picked recommendations.
Want more customers?
Our experts will research about your product and list it on SaaSworthy for FREE.