Sisense |
83% SW Score The SW Score ranks the products within a particular category on a variety of parameters, to provide a definite ranking system. Read more
Start Free Trial
|
84% SW Score The SW Score ranks the products within a particular category on a variety of parameters, to provide a definite ranking system. Read more
Start Free Trial
|
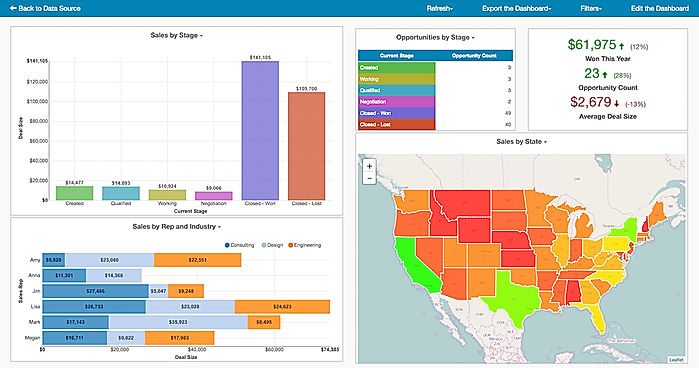
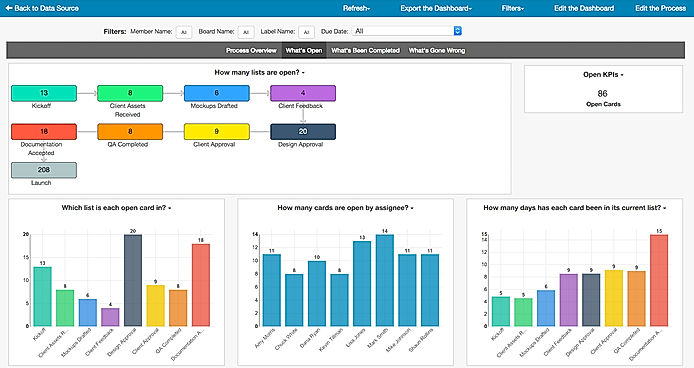
| Description | Data analysis, visualization, sharing, and monitoring are all made easier with Draxlr. Even if you don't know how to code, you can get clear business insights. Analyze and keep an eye on your SQL database. Explore data with the Query Builder, visualize it with the Data Visualizer, create a custom dashboard, and receive data change alerts via Slack and email. Data can be exported to Excel and CSV. Dashboards can be embedded.On a fully managed platform, you can analyze data, run complex queries, create graphs and charts, make dashboards with visualizations and data summaries, and much more. With just a single URL, you can easily connect your SQL databases. Draxlr Connector makes it easier to integrate Heroku databases. Perform advanced queries with our user-friendly Query Builder, and even run raw queries to fine-tune your findings. Export your results in CSV format with ease. Analyze your data and use graphs and charts to show the results. Get a summary of your information. Create a dashboard to make it easy to see the results of updates. Get data update notifications sent directly to your inbox. Read more | Easy Insight software is a platform used to connect your cloud apps to gain insights with conversion rates. Create custom tables with different data sources to optimize the reporting across your entire business on unified data. Customize dashboards into your own site to optimize a seamless user experience. Set up recurring exports of your reports and dashboards by email. Small, Medium companies make use of the software. Read more |
| Pricing Options |
|
|
| SW Score & Breakdown |
83% SW Score The SW Score ranks the products within a particular category on a variety of parameters, to provide a definite ranking system. Read more
|
84% SW Score The SW Score ranks the products within a particular category on a variety of parameters, to provide a definite ranking system. Read more
|
| Total Features |
8 Features
|
5 Features
|
| Common Features for All |
Ad hoc Analysis
Ad hoc Query
Ad hoc Reports
Benchmarking
Dashboard
Data Analysis
Key Performance Indicators
Strategic Planning
Trend Indicators
|
Ad hoc Analysis
Ad hoc Query
Ad hoc Reports
Benchmarking
Dashboard
Data Analysis
Key Performance Indicators
Strategic Planning
Trend Indicators
|
| Organization Types Supported |
|
|
| Platforms Supported |
|
|
| Modes of Support |
|
|
| API Support |
|
|
| User Rating |
Not Available
|
|
| Ratings Distribution |
Not Available
|
|
| Read All User Reviews | Read All User Reviews |
AI-Generated from the text of User Reviews
| Pricing Options |
|
|
|
Pricing Plans
Monthly Plans
Annual Plans
|
Free Free Paid $29.00 $29.00 per month Premium $149.00 $149.00 per month |
Individual (For SaaS Reporting) $29.00 $29.00 per month Team (For SaaS Reporting) $49.00 $49.00 per month Professional (For SaaS Reporting) $149.00 $149.00 per month Premium (For Custom Data Business Intelligence) $299.00 $299.00 per month Enterprise (For Custom Data Business Intelligence) $499.00 $499.00 per month Unlimited (For Custom Data Business Intelligence) $1,499.00 $1,499.00 per month |
|
View Detailed Pricing
|
View Detailed Pricing
|
|
|
iDashboards
4.5 Based on 207 Ratings |
|
| Screenshots |

+ 5 More
|
+ 1 More
|
| Videos | Not Available |
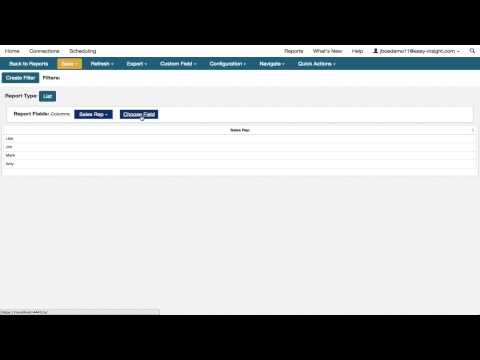
+ 1 More
|
| Company Details | Located in: 078692 90297 | Located in: Denver, CO Founded in: 2008 |
| Contact Details |
Not available https://www.draxlr.com/ |
+1 720-316-8174 https://www.easy-insight.com/ |
| Social Media Handles |
|
|
Looking for the right SaaS
We can help you choose the best SaaS for your specific requirements. Our in-house experts will assist you with their hand-picked recommendations.
Want more customers?
Our experts will research about your product and list it on SaaSworthy for FREE.