Oracle Database |
85% SW Score The SW Score ranks the products within a particular category on a variety of parameters, to provide a definite ranking system. Read more
Visit Website
|
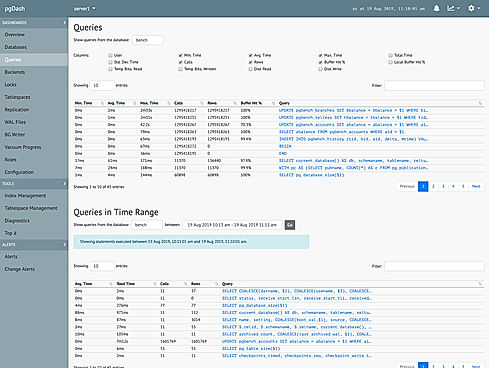
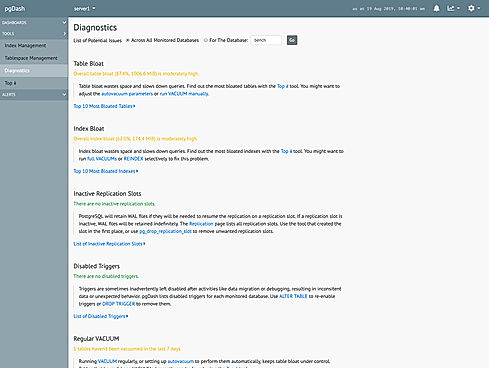
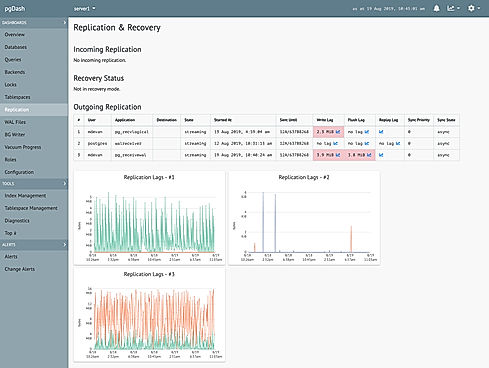
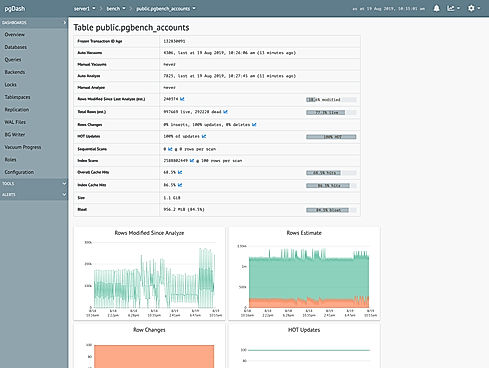
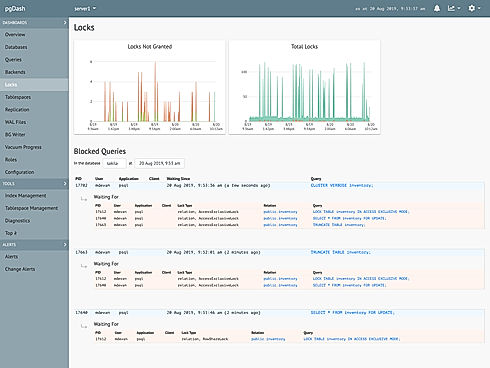
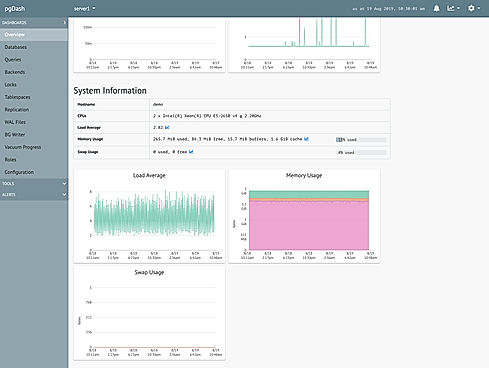
| Description | Prometheus is a metrics-based monitoring system that is designed to track an organisation's overall health, performance and behaviour. It gathers, organises and stores real-time metrics besides delivering intuitive alerts in no time. The software uses dimensional data modelling, flexible query language, modern alerting techniques and an effective time-series database to provide elegant monitoring solutions. With a cleverly designed interface and futuristic features, Prometheus delivers excellent insights derived from a variety of metrics. By implementing a highly dimensional data tool and key-value pairs, it converts data into meaningful insights. This efficient monitoring solution enables users to slice and dice collected time series data through PromQL and generate informative graphs, tables, and alerts as per convenience. Prometheus also comes loaded with a variety of sophisticated templates facilitating seamless data visualisation and integrated Grafana functionality. Furthermore, it provides an efficient storage facility for time series besides working on a simple yet reliable server. The platform’s alerting approach is rooted in PromQL and is flexibly designed. Lastly, this open-source software is completely community-driven and highly secure as well. Read more | pgDash is a comprehensive postgreSQL monitoring platform, helping out businesses ensure their present health and performance, altogether. Core reports and advanced visualisations offered by the software are of great help. The generated reports come loaded with time-based graphs and self-hosted/on-premise options, helping out teams with alerts and notifications that are most needed. Coming to the functional part pgDash depends on open-source pgmetrics to collect PostgreSQL data in JSON format, besides sending it to pgDash on a regular basis using the command line tool as per need. Large teams can use the software to share data, view information and delete unwanted information. They also get to enjoy seamless integrations with external platforms like PgBouncer and AWS CloudWatch, simultaneously. BG writer stats, index management, table space management and configuration settings are some of the additional functionalities available. Table wise information offered by pgDash is of great help, it comprises metrics like file size, bloat, vacuum, cache efficiency etc. Read more |
| Pricing Options |
|
|
| SW Score & Breakdown |
|
85% SW Score The SW Score ranks the products within a particular category on a variety of parameters, to provide a definite ranking system. Read more
|
| Total Features |
3 Features
|
9 Features
|
| Common Features for All |
Backup
Creation (Development)
Data Replication
Data Search
Database Conversion
Monitoring
Performance Analysis
Queries
Relational Interface
Virtualization
|
Backup
Creation (Development)
Data Replication
Data Search
Database Conversion
Monitoring
Performance Analysis
Queries
Relational Interface
Virtualization
|
| Organization Types Supported |
|
|
| Platforms Supported |
|
|
| Modes of Support |
|
|
| API Support |
|
|
| User Rating |
|
|
| Rating Distribution |
|
|
| User Sentiments |
Easy to Install and Configure, Extensive Integrations, Customizable Metrics, Efficient Monitoring Complex Query Language (PromQL), Limited Built-in Visualization, Steep Learning Curve, Lack of Detailed Documentation |
Not Available
|
| Review Summary |
Users praise Prometheus for its robust monitoring capabilities, highlighting its user-friendly interface, extensive metrics library, and flexible alerting system. They appreciate its ability to collect and visualize data from diverse sources, enabling comprehensive monitoring of IT infrastructure and applications. Additionally, users commend Prometheus's open-source nature, strong community support, and active development, ensuring continuous improvements and feature enhancements. While some users mention occasional performance issues or a learning curve for new users, the overall sentiment is overwhelmingly positive, reflecting Prometheus's effectiveness as a monitoring solution. |
Not Available
|
| Read All User Reviews | Read All User Reviews |
AI-Generated from the text of User Reviews
| Pricing Options |
|
|
|
Pricing Plans
Monthly Plans
Annual Plans
|
Prometheus Custom |
Basic $100.00 $100.00 per month Pro $200.00 $200.00 per month Enterprise Custom |
|
View Detailed Pricing
|
View Detailed Pricing
|
|
Splunk Enterprise
4.3 Based on 1319 Ratings
New Relic Alerts
4.5 Based on 14 Ratings |
Grafana
4.7 Based on 63 Ratings
GreyMetrics
4.7 Based on 22 Ratings
PostgreSQL
4.6 Based on 619 Ratings |
|
| Screenshots |

+ 3 More
|
+ 5 More
|
| Company Details |
Not available |
Located in: United States |
| Contact Details |
Not available https://prometheus.io/ |
Not available https://pgdash.io/ |
| Social Media Handles |
|
Not available |
Looking for the right SaaS
We can help you choose the best SaaS for your specific requirements. Our in-house experts will assist you with their hand-picked recommendations.
Want more customers?
Our experts will research about your product and list it on SaaSworthy for FREE.