Nagios XI |
79% SW Score The SW Score ranks the products within a particular category on a variety of parameters, to provide a definite ranking system. Read more
Visit Website
|
| Description | Netdata is a Linux-based software that helps to diagnose anomalies and slowdowns in your system with insightful analysis, metrics and engaging visualizations. Get a live demo of your system’s performance from various cities in the world. It covers an array of fields where data is provided like RAM, CPU, IP Address, network performance across various bandwidths, softnets, entropy, and disks. It enables you to see monitoring, Nginx, IP Networking and even monitors net data along with programming in MySQL. Netdata can be installed on any platform and detects hundreds of metrics in real-time through fully functional visualizations. It can monitor your health in real-time and moreover it is flexible and easy to integrate with hundreds of metrics. This app allows users to detect low-latency visualizations to detect any possible anomalies after comparison with metrics. The dedicated database of Netdata doesn't require resources to detect. It just collects, stores and processes data to let you visualize in low-latency and high-power resolutions followed by streaming of data and final archive. Read more | Prometheus is a metrics-based monitoring system that is designed to track an organisation's overall health, performance and behaviour. It gathers, organises and stores real-time metrics besides delivering intuitive alerts in no time. The software uses dimensional data modelling, flexible query language, modern alerting techniques and an effective time-series database to provide elegant monitoring solutions. With a cleverly designed interface and futuristic features, Prometheus delivers excellent insights derived from a variety of metrics. By implementing a highly dimensional data tool and key-value pairs, it converts data into meaningful insights. This efficient monitoring solution enables users to slice and dice collected time series data through PromQL and generate informative graphs, tables, and alerts as per convenience. Prometheus also comes loaded with a variety of sophisticated templates facilitating seamless data visualisation and integrated Grafana functionality. Furthermore, it provides an efficient storage facility for time series besides working on a simple yet reliable server. The platform’s alerting approach is rooted in PromQL and is flexibly designed. Lastly, this open-source software is completely community-driven and highly secure as well. Read more |
| Pricing Options |
|
|
| SW Score & Breakdown |
79% SW Score The SW Score ranks the products within a particular category on a variety of parameters, to provide a definite ranking system. Read more
|
|
| Organization Types Supported |
|
|
| Platforms Supported |
|
|
| Modes of Support |
|
|
| API Support |
|
|
| User Rating |
Not Available
|
|
| Ratings Distribution |
Not Available
|
|
| Review Summary |
Not Available
|
Users praise Prometheus for its robust monitoring capabilities, highlighting its user-friendly interface, extensive metrics library, and flexible alerting system. They appreciate its ability to collect and visualize data from diverse sources, enabling comprehensive monitoring of IT infrastructure and applications. Additionally, users commend Prometheus's open-source nature, strong community support, and active development, ensuring continuous improvements and feature enhancements. While some users mention occasional performance issues or a learning curve for new users, the overall sentiment is overwhelmingly positive, reflecting Prometheus's effectiveness as a monitoring solution. |
| Read All User Reviews | Read All User Reviews |
AI-Generated from the text of User Reviews
| Pricing Options |
|
|
|
Pricing Plans
Monthly Plans
Annual Plans
|
Agent OSS Free Community Free Pro $3.00 $3.00 per month Business $4.00 $4.00 per month Enterprise Custom |
Prometheus Custom |
|
View Detailed Pricing
|
View Detailed Pricing
|
|
|
Splunk Enterprise
4.3 Based on 1319 Ratings
New Relic Alerts
4.5 Based on 14 Ratings |
|
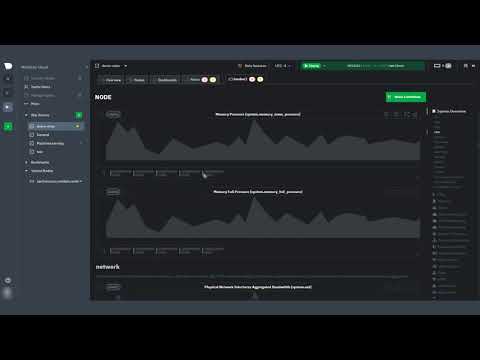
| Screenshots |

+ 2 More
|

+ 3 More
|
| Videos |
+ 2 More
|
Not Available |
| Company Details | Located in: Redwood City, California Founded in: 2018 |
Not available |
| Contact Details |
Not available https://www.netdata.cloud/ |
Not available https://prometheus.io/ |
| Social Media Handles |
|
|
Looking for the right SaaS
We can help you choose the best SaaS for your specific requirements. Our in-house experts will assist you with their hand-picked recommendations.
Want more customers?
Our experts will research about your product and list it on SaaSworthy for FREE.


