When it comes to branding, striking the right creative note is extremely important. Thanks to the rise of the internet and the growth of digital marketing, brand marketers now have a host of possibilities available to them. Brands have immediate access to their customers via social media channels, email, and other digital platforms. You can easily find your target audience thanks to today’s advanced marketing technology and hyper-personalized marketing. There’s also a lot of competition today.
Table of Contents
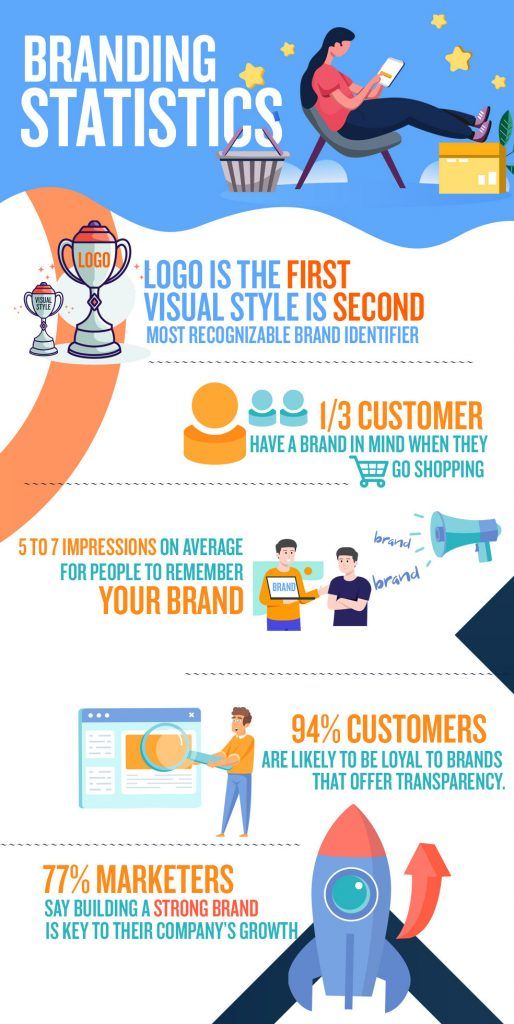
Branding Statistics that are making a difference
Since buyers find it easy to research their favorite brands before they buy, the concept of brand loyalty has gone out of the window as consumers today have multiple purchasing options. Today they can easily find options to do business with if your business isn’t up to their standards. First impressions are the most crucial impressions especially if another option is just a Google search away. Business owners that can build a great brand could try to increase customer loyalty, generate brand awareness and forge an emotional connection with their customers.
If you wish to give your brand a fresh outlook, you need to understand how customers perceive brands. Here are some important branding statistics that could help you along the way.
General Branding Statistics
Before getting into the details of how a brand affects each part of your business, you should understand the branding landscape. Here are some facts about the current branding ecosystem.
- The top 5 most valuable brands in 2020 were Amazon, Google, Apple, Microsoft, and Samsung.
- More than half of companies say that their customers expect good design and cross-channel consistency.
- Around 70% of marketers claim consistent branding is the most important point to consider when communicating with existing clients.
- Half of all employees think they don’t have the tools to enhance their employer’s brand.
- 63% of employees feel that a consistent branding experience impacts whether or not a deal gets closed.
- According to 35% of companies, an internal agency or design team is responsible for their brand’s management. Around 14% of companies depend on an external design firm or an agency to handle their brand.
- 29% of firms say they don’t have any formal brand guidelines.
- 21% of brands say their guidelines aren’t written anywhere but are communicated verbally.
- 27% of firms that have brand guidelines don’t enforce them regularly.
- 39% of firms say they struggle with employees creating off-brand content.
- Just 25% of firms say they have formal brand guidelines that are strictly enforced.
- 28% of firms claim their internal design team has the authority to make changes to the brand on their own.
- According to 62% of marketers, their company brand has moderate to excellent visibility, while 38% claim their brand has little to no visibility.
B2B Branding Statistics
- Your branding strategy needs to change depending on your audience. B2B brands are starting to see a change in the way consumers research and purchase products.
- 90% of B2B consumers begin their journey with a Google search.
- B2B consumers make 12 searches on average, before engaging on a particular brand’s site.
- According to 74% of B2B consumers, most of their research is done online before purchasing offline.
- 73% of B2B executives claim that customer expectations for more personalized experiences are at an all-time high.
- 80% of the B2B purchasing process happens with no human contact.
- Around 77% of B2B buyers claim that their last purchase was complex/difficult.
- If you focus on customer experience, beginning from front-end sales and going to ongoing support, you can increase revenue by 5% to 10%.
B2C Branding Statistics
Marketers at B2C companies face challenges when crafting their brands. B2C customers always place value on personalization and customer experience, when choosing which companies to transact with
- Around 48% of consumers state that they are more likely to be loyal to a brand during the first purchase/experience.
- 77% of B2C customers make purchases based on the brand name.
- 91% of consumers are more likely to stick to brands that provide offers and recommendations.
- According to 72% of consumers, they only engage with customized marketing messages.

- 63% of consumers stop buying products and services from firms that provide poorly executed personalization.
- 55% of marketers feel they don’t have sufficient customer data for implementing effective personalization.
- 47% of consumers will shift to Amazon if the brand that they are shopping with is not providing relevant product suggestions.
- 90% of consumers are willing to share their behavioral data if additional benefits that make shopping easier or cheaper, are provided.
Employer Branding Statistics
Your employer brand could impact everything starting from your online reputation, to employee retention and the kind of candidates that you have applying to work at your organization.
- 96% of companies think employer brand and reputation can positively/negatively impact revenue, however, only 44% actively monitor their brand’s impact.
- According to 46% of Glassdoor members, reviews matter before speaking with a company recruiter or hiring manager.
- Firms with positive brands get twice as many applications as companies with negative brands.
- According to 40% of millennials, market reputation has a big impact on their impression of an employer.
- 51% of recruiters claim employee branding is the most important investment that they will increase in the next year.
- Companies that invest in employer branding are thrice as likely to make a quality hire.
- Approximately 60% of all recruiters believe culture fit is of great importance when it comes to hiring decisions.
- Fewer than half of all employees would recommend their employer to a friend.
- Employee turnover may be reduced by 28% by investing in the employer brand.
- 80% of HR managers feel that employer branding has a great impact on the ability to hire suitable talent.
- 78% of job candidates state that the overall candidate experience they get is a good indicator of how a firm values its employees.
- 90% of job prospects would apply for a role if it is from an employer with a recognizable brand.
- Half of all candidates state they wouldn’t work for a firm with a bad reputation, even if they were offered a pay hike.
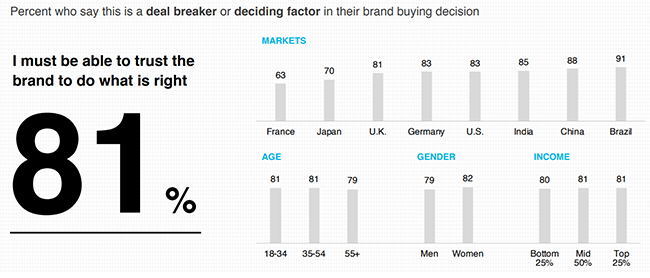
- When decision-making regarding job applications, 84% of job seekers say that the reputation of a firm as an employer is important.
- 82% of investors think brand strength and recognition are vital in guiding investment decisions.
Personal Branding Statistics
Crafting your personal brand is quite different from building a corporate identity. Solopreneurs, freelancers, or those looking to make a good impression – these personal branding statistics might help.
- Leads that come from employees’ social media activities have a 7X higher conversion rate than other leads.
- On average, employees have 10X more followers than their company’s social media accounts.
- Content that employees share receives 8X more engagement than content shared by brand channels.
- Sales reps that depend on social media as part of their sales techniques outsell around 78% of their peers.
- 82% of customers trust firms whose senior management members are active on social media.
- Employees at firms that invest in personal branding initiatives are 27% more likely to feel optimistic about their firm’s future.
- 70% of American recruiters and HR personnel have rejected candidates based on information sourced online.
- 85% of American recruiters and HR personnel claim that an employee’s online reputation influences their hiring decisions to some extent.
Brand Design Statistics
Aspects like colors and logos really impact your brand image. The right font to is important. Branding however goes much further than just visual elements. Having said that, the aesthetics of your brand could impact your business.
- Apple, Nike, Coca-Cola, Google, and FedEx were voted by consumers to have the most visually aesthetic logos
- Using a signature color could boost brand recognition by 80%.
- 73% of businesses invest in design so their brand stands out against the competition.
- Choosing the right shades for your brand could boost brand recognition by around 80%.
- 33% of the top 100 global brands use the blue color in their logo.
- 67% of small businesses are willing to shell out $500 or more for a logo.
- The right color could boost readership by around 40% by making messaging easier to read and visually appealing.
- 50 milliseconds is what it takes for consumers to judge your brand’s visual appeal.
- 90% of the information transmitted to the brain is visual.
- 90% of immediate judgments consumers make about products are because of color.
- 72% of the top brands are named with made-up words or acronyms.
Digital Marketing and Branding Statistics
Want to promote your brand to the masses? Social media, content marketing, SEO, and other digital methods are great ways to boost brand value.
- The top 3 channels SMBs plan to extend their employer brand with our company site (69%), online professional networks (61%), and social media (47%).
- Around 52% of people say they post on SM once a month regarding products they have purchased.
- 71% of consumers claim they are more likely to purchase from a brand that they follow on social media.
- 80% of consumers ignore ads on websites or search results.
- Half of LinkedIn users say they are more likely to purchase from a company that they interact with on LinkedIn.
- 43% of consumers feel the urge to purchase after seeing an Instagram ad.
- 38% of users stop interacting with a website if the layout is not attractive.
- Long landing pages could generate around 220% more leads than above-the-fold calls to action.
- 88% of Pinterest users will purchase something they’ve pinned.
- If you maintain a consistent brand presence across all platforms, your revenue could increase by around 23%.
- 80% of marketers say that they use visual assets in SM marketing.
- 64% of consumers make a purchase after seeing a branded social video.
- 33% of millennials, compared to 20% of GenX and 6% of Boomers, claim their purchasing decisions are influenced by what they see online.
- Consumers spend 10 times more time looking at visuals on a website than they spend looking at the text.
- Firms that maintain brand consistency across all channels have an average growth of 33%.
- 42% of online shoppers form their opinion of a website based on design alone.
- A video on your landing page could boost conversion rates by around 86%.
Wrapping Up
And there you have it! For firms or digital marketers looking for an effective branding strategy, the above statistics can be a great starting point. You can refer to these surveys we researched to compile this list –
Looking for more stats? You may find these articles helpful:
Top Sales Enablement Statistics in 2022


