Raw data may not always tell the most convincing story. Sometimes, words don’t always give the best image. But the human brain is sensitive to visual information. This is the reason data visualization is an effective instrument for communication. If “Data Visualization” is a technical and challenging concept, do not worry; it doesn’t have to be. Making data visualizations isn’t simple. It’s not like designers could draw a dataset with thousands of entries and visualize it entirely from scratch.
Instead, it’s possible, but who would like to commit dozens or even hundreds of hours drawing dots on an equilateral scatter chart? This is where the tools to visualize data can help. Humans are wired to be connected to stories. In its purest form, data doesn’t feel like an actual story. It is precisely the opposite. But what happens when you watch the numbers change into visuals? This tells an account with an obvious beginning, middle, and end. Visualizations provide all you need to know the story of your business from beginning to end. That’s why we’ve made the top 5 data visualization software tools in the market in 2022! Let’s get started.
Table of Contents
What is Data Visualization Software Tool?
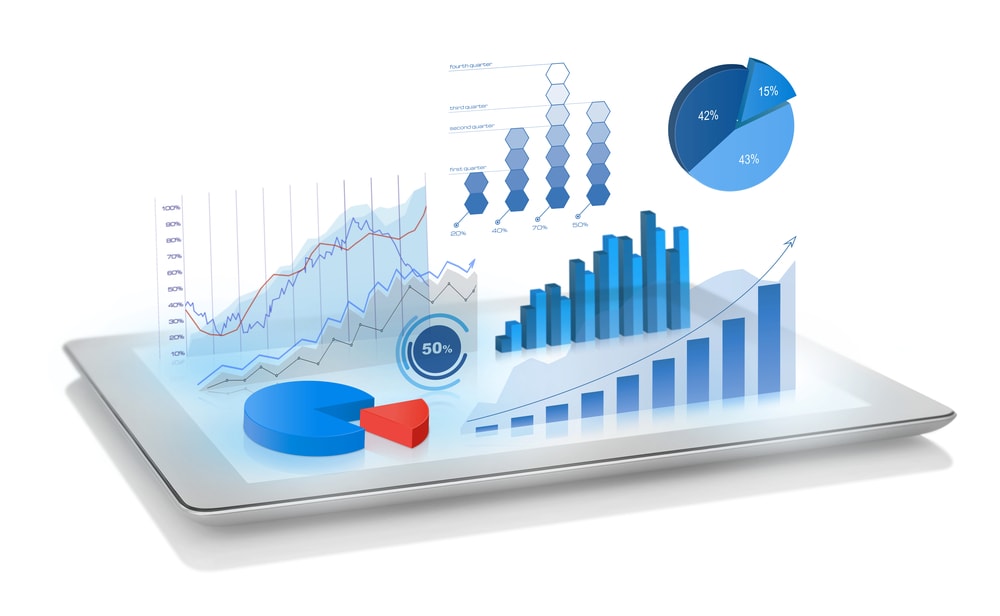
Data Visualization is the graphic representation of data on charts, maps, sparklines, infographics—heat maps, and statistical graphs. The term “data visualization” refers to the graphic representation of information or data. For instance, taking the raw data from spreadsheets and turning the data into a bar or line graph.
Visual data are simple to comprehend and analyze, allowing the efficient extraction of helpful information. Relevant stakeholders can then use the information to make more effective real-time decisions. Data visualization tools can help you quickly analyze and understand patterns and outcomes in your data. The best way to visualize your data will depend on the narrative you want to convey. You can pick any visual and think it will suffice; however, it’s worth the effort and time to choose and personalize the correct visualization to ensure lasting impact. “Where should you place visualizations of data?”
Data visualizations aid us in telling stories. Humans are visual beings. We’re drawn to patterns, colors, and patterns. Thus,
using these fundamental human characteristics to transform numbers into images is an excellent capability.
Business dashboards show data visualizations that will assist you in:
- Monitor critical metrics that affect the performance of your business.
- Integrate your datasets and data sources into one location.
- Give a quick overview of the business’s performance for important decision-makers.
- Bring your team members to be on the same page concerning the performance and results.
- Intuitively and effectively interpret the data.
That’s why we’ve made the top 5 Data Visualization Software tools in 2022.
Let’s have a look.
Top 5 Data Visualization Software tools in 2022.
The guide below will assist you in determining the most suitable software for your requirements in terms of statistical analysis. You’re sure to find the perfect solution for your company here. We’ll also list their top features, the most utilized features, and the full description of each one below.
Qlik Sense
Our list starts with Qlik Sense. Qlik is a data visualization program that helps to transform raw data into information.
Qlik Sense is a data visualization platform that assists businesses in becoming more data-driven by offering an associative data analytics engine and a sophisticated Artificial Intelligence system. The software functions as an individual brain working with “association” and can move anywhere to search for solutions as it offers data visualization and exploration for individuals and teams.
The data discovery tool of the software assists enterprises of all sizes analyze the most complex and straightforward data and identifying all possible relationships with their datasets.
It is easy to combine load, visualize and examine your data using Qlik Sense, no matter the size. Every chart, table, and other is dynamic and immediately up-to-date following the current data context.
- Deployment – Cloud, SaaS, Web-Based.
- Platform – Mac, Windows, Linux, Android, iPhone, iPad.
- Top Features – Data Synchronization, Data Transformation, Data Visualization Software, Drag & Drop, Data Cleansing, Data Connectors, Data Dictionary Management, Data Discovery Software, KPI Monitoring, Key Performance, Indicators Marketing, Automation Software, Marketing Reports, Match & Merge, Metadata Management.
- Free Trial & Version Available
- Prize – $30/month.
- Best for – Big Data Software, Business Management Software, Conversational AI Platform Software, Decision Support Software, Embedded Analytics Software, Sales Forecasting Software, Statistical Analysis Software.
- Support – Email/Help Desk, FAQs/Forum, Knowledge Base, Phone Support.
- Overall Rating – 5/5 Stars
Sisense
The second that comes on the list is Sisense. Sisense is the sole software for business intelligence that makes it simple for users to gather, analyze, and visualize complex data.
It is software for data visualization that makes complex data easier to understand. It is among the most effective tools for data visualization that can help you convert data into functional, practical elements or visualizations.
The Sisense platform for data and analytics is straightforward: it combines data from the entire data landscape into highly effective, actionable analytics software that can be integrated into any location.
- Deployment – Cloud, SaaS, Web-Based.
- Platform – Windows, Linux, iPhone, iPad.
- Top Features – Data Visualization Software, Data Connectors, Data Discovery Software, Data Import/Export, Conversion Tracking, Customizable Branding, Customizable Dashboard, Goal Setting/Tracking, High Volume Processing, Integration into Third Party Applications, Interactive Reports, KPI Monitoring, Key Performance Indicators, Keyword Tracking, Machine Learning Software, Dashboard Creation, Dashboard Software, Drag & Drop.
- Free Trial Available
- Prize – Price not provided by the vendor.
- Best for – Artificial Intelligence Software, Big Data Software, Business Intelligence Software, Business Performance Management Software, Dashboard Software, Data Analysis Software, Data Management Software, Data Preparation Software, Data Visualization Software.
- Support – Email/Help Desk, FAQs/Forum, Knowledge Base, Phone Support.
- Overall Rating – 4.8/5 Stars
Slemma
Slemma Is third on the list. Slemma is a robust reporting tool that allows users to quickly build dynamic dashboards using various data sets.
The platform provides a step-by-step chart that allows report creation to be quick and effortless, allowing companies to present their data from third parties in minutes.
With Slemma’s unique capabilities for collaboration, dashboards and reports are easily shared with colleagues and clients. It helps business leaders track and increase KPIs, speed up internal decision-making processes, and win more customers.
Slemma will help you grow your business by releasing your data while providing insights that all employees in your company can comprehend and implement.
- Deployment – Cloud, SaaS, Web-Based.
- Top Features – API, Access Controls/Permissions, Activity Dashboard, Campaign Management Software, Charting Content Management System (CMS) Software, Customization Dashboard, Creation Dashboard Software, Data Connectors, Data Import/Export, Data Visualization Software, Drag & Drop, Financial Reporting Software, Conversion Tracking, Customizable Branding, Customizable Dashboard, Customizable Reports, Customizable Templates.
- Free Trial Available
- Prize – Price not provided by the vendor.
- Best for – Business Intelligence Software, Dashboard Software, Data Visualization Software, Marketing Analytics Software, Reporting Software, Sales Forecasting Software, Statistical Analysis Software, Web Analytics Software.
- Support – Email/Help Desk, FAQs/Forum, Knowledge Base, Phone Support.
- Overall Rating – 4.7/5 Stars
Qrvey
Qrvey is an online business analytics platform that provides enterprises with tools to collect data and analyze it through visualization and automation. Qrvey was developed for the modern data requirements and is a reputable semi and unstructured dark information source. It’s ideal for distributed and embedded use instances. It lets analysts collect and enhance semi-structured or non-structured business information, such as photographs, films, and videos from various sources, including third-party applications and web-based forms.
It combines data collection, analysis, transformation, automation, and machine learning using a microservices-based, serverless architecture that’s highly flexible and scalable. It’s also cost-effective.
- Deployment – Cloud, SaaS, Web-Based.
- Top Features – Customizable Templates, Customization Dashboard, Benchmarking, Charting, Collaboration Tools, Content Management System (CMS), Software Contextual Search, Data Dictionary Management, Data Discovery Software, Data Import/Export, Data Management Software, Data Mapping, Data Migration, Data Replication.
- Free Trial Available
- Prize – $25,000/year.
- Best for – Big Data Software, Business Intelligence Software, Dashboard Software, Data Analysis Software, Data Discovery Software, Data Visualization Software, Embedded Analytics Software, Predictive Analytics Software, Reporting Software.
- Support – Email/Help Desk FAQs/Forum Knowledge Base Phone Support.
- Overall Rating – 4.7/5 Stars
Tableau
Tableau can help people transform data into actionable information that makes an impact. Connect easily to data anywhere and with any data. The Tableau platform offers the range and range of features that meet the requirements of the largest global corporations with a seamless, seamless experience.
Tableau is built to complement rather than dictate your data strategy. It adapts to your specific environment with unparalleled options while meeting the most rigorous security and governance requirements.
- Deployment – Cloud, SaaS, Web-Based.
- Platform – Windows, Mac, Linux, Android, iPhone, iPad.
- Top Features – Data Visualization, Data Mapping, Data Migration, Data Quality Control, Data Security, Data Storage Management, Data Transformation, False Positives Reduction, File Storage, Data Cleansing, Data Coding, Data Connectors, Data Dictionary Management, Data Discovery, Software Data, Import/Export, Data Integration, Data Management Software, Financial Reporting, Software Data Warehousing.
- Free Trial & Version Available
- Prize – Price not provided by the vendor.
- Best for – Business Intelligence Software, Dashboard Software, Data Analysis Software, Data Discovery Software, Data Management Software, Data Visualization Software, Heatmap Software, Marketing Analytics Software, and Predictive Analytics Software.
- Support – Email/Help Desk FAQs/Forum Knowledge Base Phone Support.
- Overall Rating – 4.4/5 Stars
Conclusion
By now, you should have a clear-cut idea about the basics of what you’re seeking. Every software on this list is designed to assist you in obtaining efficient data presentation of your business, from start to finish through data visualization. Summary charts display a single numeric value. This is the ideal visualization option to display a single or sum number on the dashboard.
Choosing the most powerful tool can be the wrong choice: the learning curve could be long and require more resources to begin, and a lesser-powerful tool could be able to make exactly what you need in only a fraction of the time. This tool is just one aspect of making a data visualization. Designers must also consider the other elements that create a compelling data visualization.