Streaming has altered the way we consume media. Streaming refers to any on-demand source of online entertainment that allows consumers to access audio or visual content. The providers of such services usually charge membership fees that may take two forms i.e pay per view or subscription. Free streaming exists courtesy of user-made content platforms like YouTube. The streaming industry has been subject to tremendous change and this may carry on for years to come. Here are some important streaming statistics you should know. Have a look!

Table of Contents
General Music Streaming Statistics
- 23\% of all on-demand streaming time was made up of paid audio streaming in 2017, with free streaming coming in a close second at 22\%.
- There are around 186.7 million digital music users in America.
- SoundCloud has more than 10 million music creators, 177 million tracks, and over a billion users.
- One of the Key Performance factors for music streaming services is library size. TIDAL has more than 60 million tracks, Apple Music has 50 million and Spotify has around 40 million tracks.
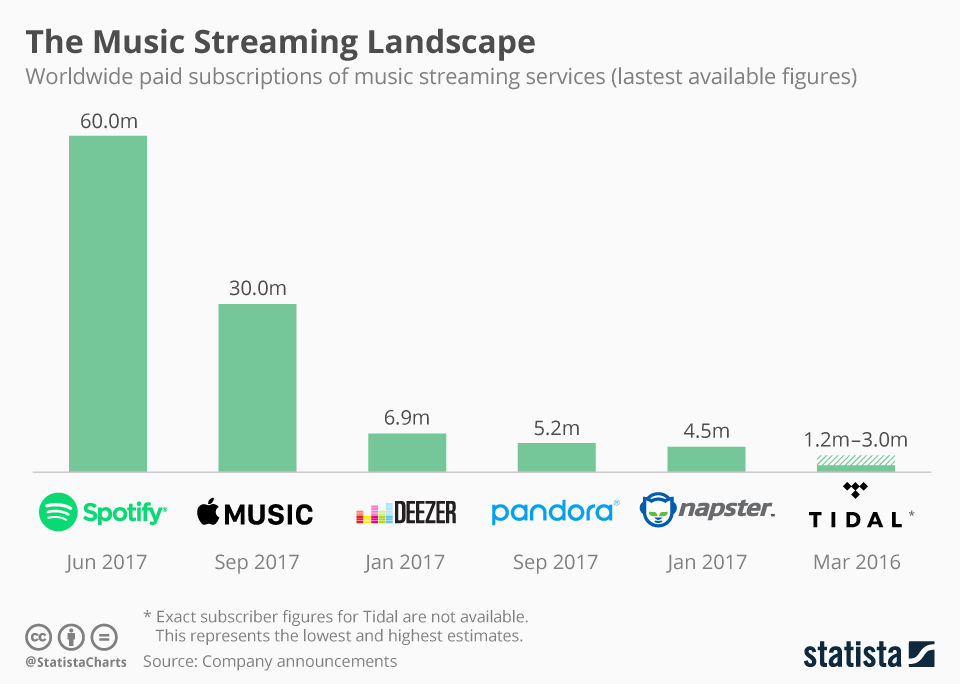
- Apple Music has the largest number of paying users, with over 95 million in the US alone, as of April 2019.
- In 2018, Americans streamed more than 900 billion songs.
- The number of on-demand audio streams increased by 49\% in 2018, up to around 611 billion.
- From 2013 to 2018, the number of songs streamed over the net has increased by around 800\%.
- 80\% of consumers in the US claim that a variety of music and a low price point is the most vital features of a music streaming service.
- The least important feature in a music streaming service is curated playlists, at 51\%, and Artist Exclusives, at 46\%.
Music Streaming and Monetisation
- Currently, digital music subscription and streaming revenue stand at $5.66 billion.
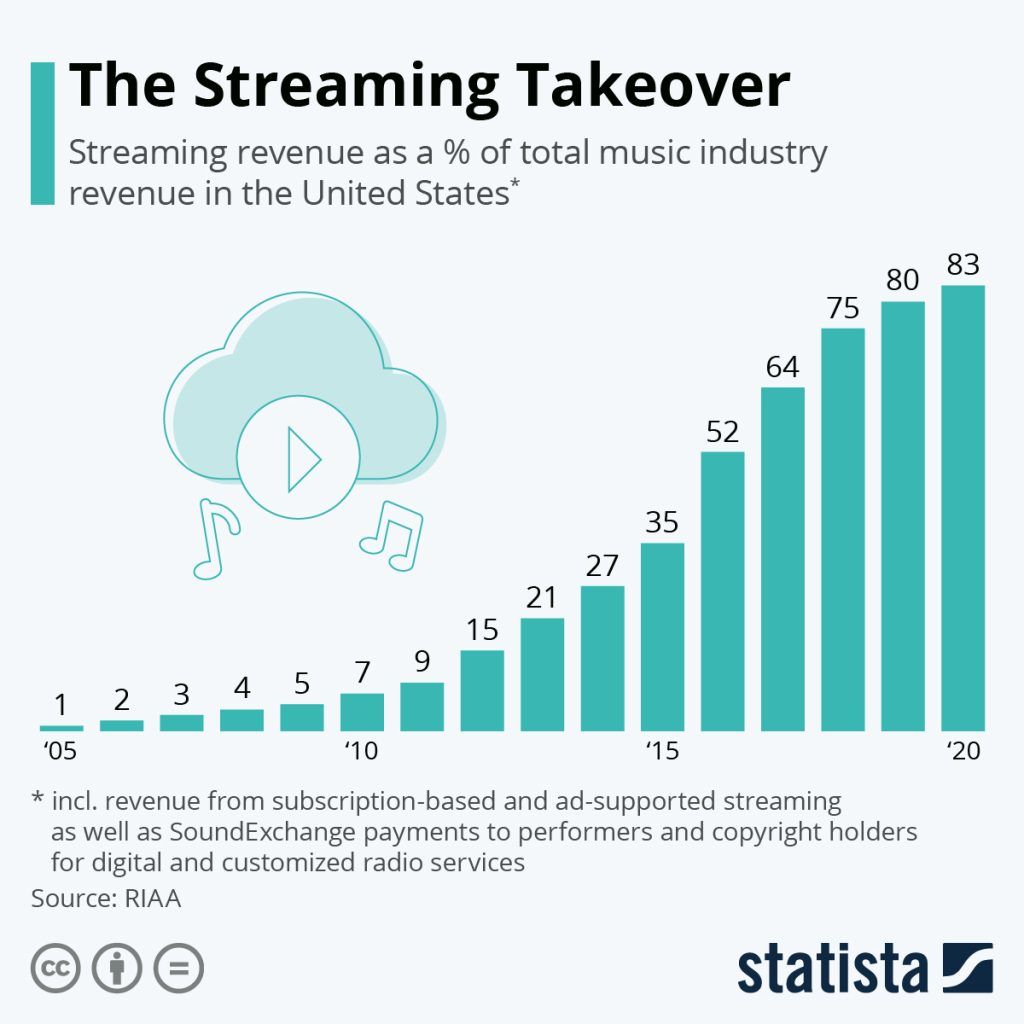
- The music industry is primarily centered around digital streaming, with streaming revenue increasing by over 41\% in 2017, while download revenue decreased by over 20\% and physical revenue by around 5\%.
- 14\% of the population uses paid music streaming services multiple times a day.
- 70\% of all digital music revenue in Europe came from paid subscription services.
- Only 47\% of digital music revenue in the US was from paid subscription services.
- 80\% of all American consumers say that a variety of music and a low price point is the most vital features of a music streaming service.
- The least important feature of music streaming services for consumers have curated playlists at 51\% and artist exclusives at 46\%
- The best streaming service for musicians is Napster, which pays 0.019 cents per play. An artist needs 77000 or more plays to earn the US minimum monthly wage of $1462.
- Around 38\% of all music industry revenue came from streaming services in 2017.
Podcast Streaming Statistics
Choosing the correct audio editing software for your podcast is as important as deciding what to talk about.
- There are approximately 73 million regular podcast listeners in the US.
- Over half of all podcast listeners are male.
- Podcasts span around 100 languages worldwide.
- Around 189 million people over the age of 12 in the US have listened to online audio in 2019.
- 91\% of people aged 12-24 have listened to online audio.
- Podcast listeners tend to be around 13\% more active on social media platforms than the general population.
- 51\% of the American population has listened to a podcast.
- Podcast listening is conducted mostly at home (49\%) followed by the car at 22\%.
- 70\% of the US population knows and is familiar with podcasts.
- On a weekly basis, around 62 million people listen to podcasts.
- 16 million people in the US identify as avid podcast fans.
- 26\% of the US population regularly listens to podcasts.
- In 2020, US podcasting revenue increased to around $659 million.
- 10\% of consumers listen to podcasts daily.
- Smartphones are the most popular way of tuning into podcasts.
- 54\% of podcast listeners on smartphones use iPhones.
- Podcasts comprise around 22\% of all audio content listened to in cars.
General Video Streaming Statistics
- Currently, digital video revenue is estimated to be around $11.34 billion.
- Over 70\% of consumers believe that traditional television loses out to streaming subscriptions.
- 45.2\% is the penetration rate for digital video streaming in the US.
- Around 60\% of GenZ and Millennial consumers stream videos daily.
- Audiences are more likely to use paid video streaming services.
- Less than 30\% of all baby boomers use streaming services daily.
- Globally, the video streaming market is estimated to be around $124.57 billion by 2025.
- Consumers in the US spend as much time watching videos as they do working.
- Around 55\% of US households have a paid streaming service.
- Around a quarter of all consumers report not using traditional cable TV.
- Of those consumers that possess traditional cable services, 56\% say it’s only because it is included in their internet plans.
- GenX, millennials, and GenZ binge the most episodes, with all groups watching around 6-7 episodes in a single setting. In contrast, boomers watch only 5.
- In 2017, US consumers spent around $200 billion a month on video streaming.
- Around 36\% of consumers report having both streaming and cable or satellite.
- 59\% of all adults use cable TV for their consumption, with only 28\% using streaming services.
- Those with a college degree are more likely to use streaming services, with 35\% of degree holders using these services as opposed to 22\% with a high school diploma or less.
- 14\% of households earning under $30,000, depending on a digital antenna for TV viewing.
Live Streaming Services
- From 2015 to 2016, there was an 81\% increase in live video viewership.
- Around 56\% of respondents to a LIvestream.com survey reported that breaking news was their most-watched live content.
- 80\% of brand audiences would rather watch live video from a brand and 82\% prefer live media to social posts.
- Live viewers are 67\% more likely to purchase a ticket to a concert or event after seeing a live video of that event.
- Audiences prefer behind-the-scenes access, with 87\% preferring to view online TV if it meant more behind-the-scenes content.
- 45\% of viewers are willing to pay for living, exclusive, or on-demand video content from a favorite celeb, speaker, or group.
- Around 3.5 minutes is spent on live video, as against 2.8 minutes for VOD playback.
- Live video recorded a 113\% increase in ad growth yearly.
- 45\% of people on the net saw at least one online video over the course of a month.
- According to Livestream.com, YouTube live happens to be one of the most popular video platforms, as it is chosen by 70\% of respondents.
Video Streaming Platform Usage
- YouTube boasts of more than a billion users, making it the largest streaming site in the world, accounting for nearly a third of the net.
- 70\% of YouTube watch time comes from phones.
- As of 2019, Netflix has 148 million subscribers worldwide and is the most popular video streaming site in the US and in the majority of the world.
- Amazon Prime happens to have the largest video streaming library with around 20,000 movies and TV shows.
- There are over 1,535,062 unique viewers of independent streaming with over 58,249 live channels for gaming services on Twitch.
- Amazon Prime has more than 100 million subscribers in the US.
- The US exclusive service HULU has over 25 million subscribers.
- The Chinese video streaming company iQIYI earned more than $2.6 billion in 2017.
- 57\% of the US public depends on some permutation of streaming services.
- More than half of all Americans have a Netflix subscription.
Mobile Video Streaming Statistics
- Customers prefer streaming options on mobiles and are willing to pay for them. Non-gaming streaming apps earned an aggregate of around $19 billion worldwide in 2018.
- The time spent on the top 5 video streaming apps increased 140\% between 2016 and 2018.
- Thanks to the large population, consumers in India spent around 45 billion hours watching app-based video streaming services in 2018, more than twice their American counterparts.
- South Korean consumers watched the most hours per person of video content at around 10 billion hours in 2018. Spread over their population of 51 million, this averages out to around 2000 hours per individual.
- As YouTube is banned in China, Tencent Video remains the most popular and widely used streaming app in the country.
- With the Chinese exception aside, YouTube remains the most-used video streaming app in every country.
Wrapping Up
The uses of streaming services may be obvious at first glance, but a lot of important insights can be gained if we dive deeper into this medium. Try to turn this information into something you can use to leverage the constantly-growing power of streaming services. If you are looking at reading more such Statistics articles, check out our Statistics blogs here!