Instagram remains a powerhouse in the social media world, consistently redefining marketing strategies and driving user engagement on a global scale. With its visual appeal, versatile features, and expansive reach, it has become an indispensable platform for brands, influencers, and users.
As we move into 2025, it’s crucial to understand Instagram’s impact on consumer behavior and marketing trends. Here, we present 50 key Instagram statistics that highlight Instagram’s influence across various demographics, user interactions, and emerging trends—insights that can help shape effective marketing strategies for the coming year.
Table of Contents
User Demographics Instagram Statistics
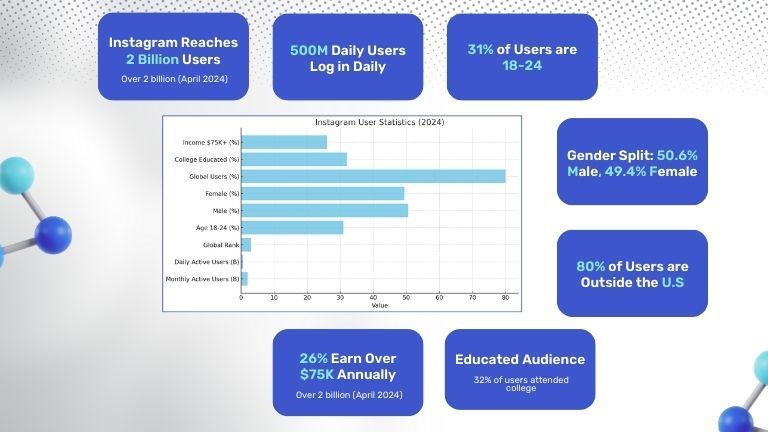
- Monthly Active Users: As of April 2024, Instagram’s user base had surged to over 2 billion monthly active users, securing its position as a leading social media platform worldwide.
- Daily Active Users: With around 500 million users logging in daily, Instagram maintains a strong level of daily engagement.
- Global Reach: Instagram is the third most-used social media platform globally, following Facebook and YouTube.
- Age Distribution: Users aged 18-24 make up about 31% of the total user base, establishing Instagram as a go-to platform for younger audiences.
- Gender Split: The platform has an almost equal gender distribution, with 50.6% male and 49.4% female users, reflecting a broad appeal across genders.
- International Users: Around 80% of Instagram’s user base is located outside the U.S., highlighting its wide global influence.
- Educational Background: Approximately 32% of users have attended college, indicating a well-educated audience.
- Income Level: Roughly 26% of users earn over $75,000 annually, suggesting a significant portion of affluent users.
Engagement Metrics Instagram Statistics
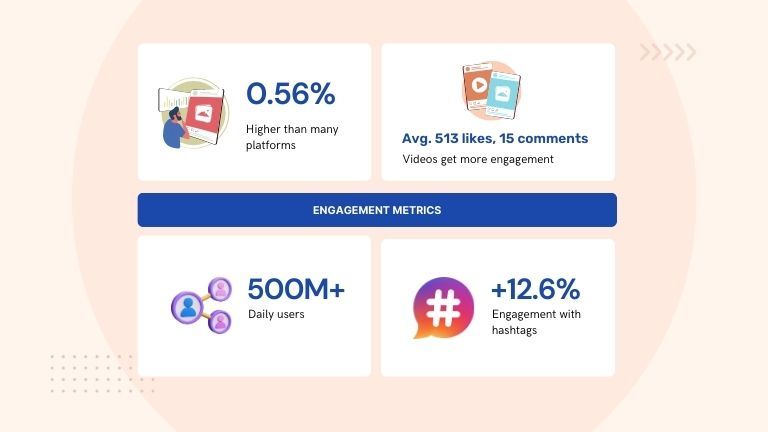
- Average Engagement Rate: Instagram posts have an average engagement rate of 0.56%, which is comparatively higher than many other social media platforms.
- Likes and Comments: On average, posts receive about 513 likes and 15 comments, with video posts typically receiving more engagement than images.
- Stories Usage: Over 500 million users engage with Stories daily, showcasing its enduring popularity.
- Hashtag Impact: Posts with at least one hashtag achieve an average of 12.6% more engagement than those without, making hashtags an effective engagement tool.
Content Performance Instagram Statistics
- Photo and Video Sharing: Users upload more than 95 million photos and videos daily, contributing to Instagram’s rich visual content ecosystem.
- Most-Liked Post: The most-liked post on Instagram features Lionel Messi, garnering nearly 75 million likes.
- Top Hashtags: The hashtag #Love has been used over 2.1 billion times, making it the most popular hashtag on the platform.
Advertising Insights Instagram Statistics
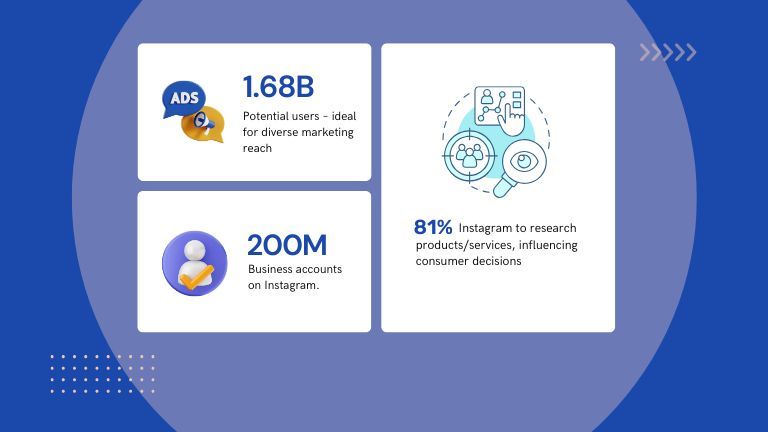
- Ad Audience Size: Instagram’s potential advertising audience is about 1.68 billion users, making it a prime platform for marketers to reach diverse demographics.
- Business Profiles: There are over 200 million business accounts on Instagram, underscoring the platform’s value to brands and entrepreneurs.
- User Research Behavior: Around 81% of users rely on Instagram to research products or services, emphasizing its role in influencing consumer decisions.
Also read: How to Use an Instagram Tracker to Monitor Social Media Activity
User Behavior Trends Instagram Statistics
- Time Spent on Platform: Users spend an average of about 33 minutes per day on Instagram, which reflects high levels of engagement.
- Shopping Frequency: Nearly 50% of Instagram users report shopping on the platform at least once a week, highlighting its e-commerce potential.
- Explore Page Use: Approximately 50% of users visit the Explore page monthly, indicating a strong interest in discovering new content.
Emerging Trends Instagram Statistics
- Video Content Dominance: Video posts generate more than twice the engagement of image posts, showing a clear shift towards dynamic content formats.
- Influencer Marketing Growth: Around 80% of marketers worldwide utilize Instagram for influencer marketing, making it a crucial channel for brand promotion and outreach.
Global Influence Instagram Statistics
- Top Countries by Users:
- India: 385 million users
- United States: 166 million users
- Brazil: 134 million users
Cyberbullying Concerns Instagram Statistics
- Surveys indicate that Instagram is a primary platform for cyberbullying, especially among teenagers, raising concerns about user safety and mental health.
Platform Features and Updates Instagram Statistics
- Most Downloaded App in 2024: Instagram was the most downloaded app globally in 2024, with over 696 million downloads.
- Search Popularity: Instagram is the sixth most searched term on Google, garnering around 414 million searches per month.
Marketing Effectiveness Instagram Statistics
- Conversion Rates from Ads: Instagram ads are known to convert at higher rates than those on other platforms due to precise targeting options.
- Brand Interaction Rates: Over 90% of users follow at least one business account, indicating substantial engagement with brands on the platform.
Miscellaneous Facts Instagram Statistics
- Top Emoji: The heart emoji ❤️ is the most commonly used emoji in Instagram posts and comments.
- Location Tags: Posts with location tags experience about 79% more engagement compared to those without.
- Follower Statistics: The average user follows approximately 200 accounts.
- Engagement on Photos with People: Posts featuring people tend to receive 38% more likes than those without people.
- Lifetime Content Shared: Since its launch, over 40 billion photos have been shared on Instagram.
- Best Posting Times: The optimal times to post on Instagram are between 11 AM and 1 PM on weekdays.
- Verified Accounts: Only 3–5% of Instagram accounts are verified, maintaining a select pool of distinguished profiles.
FAQs
What are some of the most significant changes in Instagram usage trends in 2024?
In 2024, notable trends include increased video consumption, higher engagement with Reels, and a shift towards interactive content like polls, quizzes, and AR filters that enhance user engagement.
Which Instagram demographics are showing the most growth this year?
Younger audiences, particularly Gen Z users, continue to grow, but there’s also a notable increase in older demographics engaging on the platform, which broadens Instagram’s reach across age groups.
How does Instagram compare to other social media platforms in terms of engagement rates?
Instagram consistently ranks among the highest for user engagement compared to other platforms, especially through features like Stories, Reels, and live streaming that encourage direct interaction.
What insights can marketers gain from these Instagram statistics for 2024?
Marketers can identify which content types drive the most engagement, the best times to post, preferred ad formats, and the kinds of influencers or partnerships that resonate most with target audiences.