Sometimes, you feel gutted that your SaaS company is performing optimally. However, you can never be 100\% sure. Numbers are difficult to crunch and read. A casual search for SaaS financial metrics and other KPIs throws up dozens of calculations you must go through to figure out whether your SaaS business is doing well. Thankfully, none of these calculations have to be done manually. Computers help us with them. As a SaaS business owner, you must figure out which calculations to focus on. Here are the SaaS metrics you must work out for accurate reporting.
Table of Contents
SaaS Reporting – Why is it Important?
The most important metric for determining the success of a SaaS company is its revenue growth rate, which is measured using specific metrics of SaaS reporting. SaaS businesses allow customers to access software as a service via a subscription. The software is not a tangible product that the customer holds in their hands. Typically, it may be something that is downloaded online. The SaaS business creates the software, maintaining it over time through servers, IT, and updates. However, ignoring important metrics means you’re also boycotting long-term revenue growth for your SaaS company. The last thing you want is to wake up one day only to find out that the company has been hemorrhaging money because you haven’t been able to recover the investment you made to acquire customers quickly enough.
Either that or you’ve mistakenly ignored signs that things were going downhill because you did not look at the numbers. SaaS firms have a quick growth rate, and you can only evaluate your company’s growth is to compare it to similarly-sized companies. Usually, the growth rate of companies tends to decline as revenue increases. This is a simple yet essential metric to discover why revenue growth is as good as it used to be. Reporting ensures your SaaS business experiences steady growth while keeping you in the loop regarding where you stand every step of the way. Metrics in SaaS reporting are usually static throughout the industry. Some of these metrics might be known by slightly different names, or some SaaS firms may measure specific metrics that they think matter for their company. In general, here are the metrics that you see in a typical SaaS report.
SaaS Financial Metrics

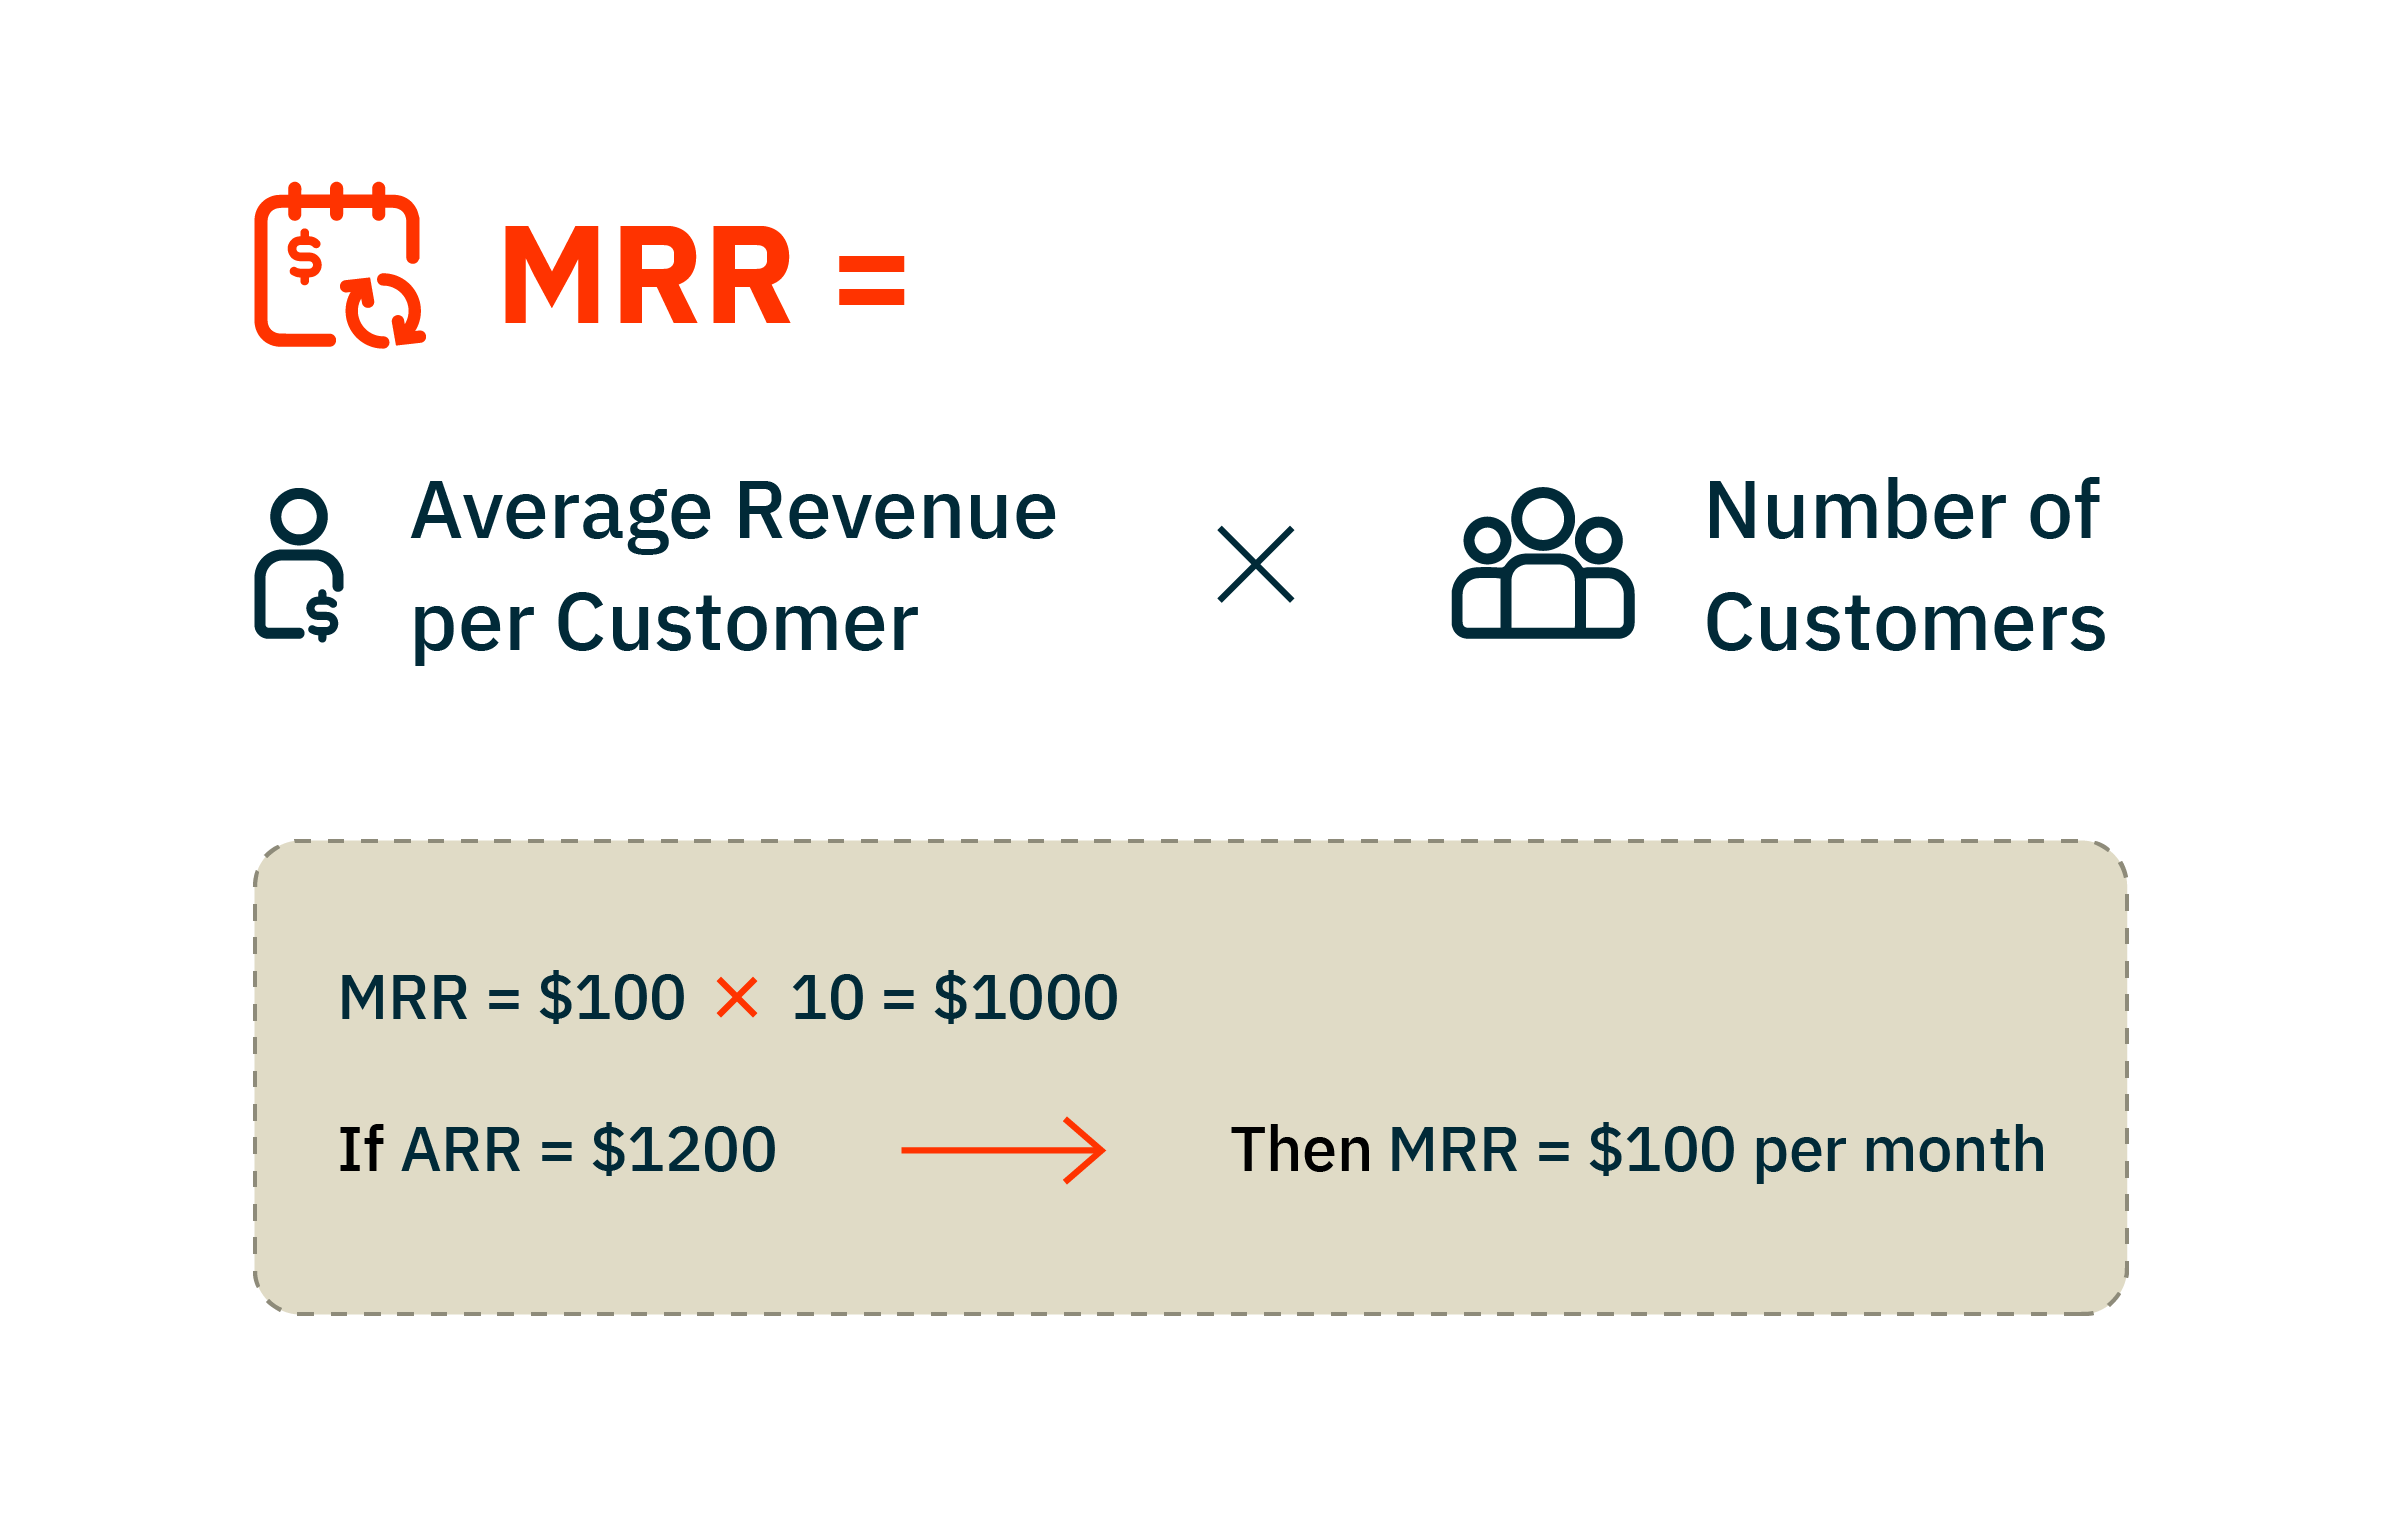
MRR (Monthly Recurring Revenue) is the amount of revenue your SaaS company could expect to generate each month. Calculate MRR by taking the total number of customers and multiplying it by the average billed amount.
Using MRR, you may evaluate your firm’s overall success. Your company is growing if your MRR goes up over time. If the MRR seems to be continuously reducing, it’s time to rethink, as your company may be in trouble. This MRR metric is very important for subscription-based SaaS firms, as the MRR tends to compound over time, either in an upward or downward direction.
Different MRR Calculations
- New MRR – This refers to the level of monthly revenue that new customers generate
- Expansion MRR – This is the recurring revenue of your current customers.
- Churn MRR – This is the revenue lost due to cancellations or downgrades.
- Net New MRR – This tells you the amount of MRR that you are losing or gaining. It is calculated using the 3 MRR types listed above, i.e., New MRR+Expansion MRR- Churn MRR = Net New MRR)
Here are some other metrics that matter –
- Revenue Churn Rate focuses on the revenue lost over a particular period. Measure it by dividing your Churn MRR by your Total MRR for a specific period.
- ARR – or Annual Recurring Revenue is the revenue your SaaS company may generate each year. To calculate ARR, multiply the number of monthly subscribers by the average revenue per customer (ARPU), which is explained in further detail below.
Cohort Analysis in SaaS

Using SaaS Cohort Analysis, you may target pain points in the customer life cycle. Cohort Analysis offers a more actionable way of viewing data instead of focusing on high-level metrics like customer churn rate or conversion rate. A Cohort refers to a grouping of customers based on a particular set of criteria. For instance, you may group customers that signed up in the same month together. Suppose you do so and calculate that the customer churn rate has increased by a certain percentage for that month. Once you know your churn rate is high, you need to find a way to reduce it. Using Cohort Analysis SaaS, you may see that the churn rate is the highest during the first month of a customer’s life cycle. That’s a more actionable statistic because you now realize you have to figure out why customers are leaving in the first month so you can reduce your churn rate.
SaaS Sales Metrics

Using SaaS sales metrics for reporting is vital to help your salespeople know whether their efforts are impacting the business positively and so you understand customers better.
Customer Churn Rate and Revenue Churn Rate
The amount of customers you lose directly translates to lost revenue. Customer Churn Rate and Revenue Churn Rate may be the same. Well, not necessarily.
What is Customer Churn Rate?
Customer Churn Rate or Subscriber Churn Rate refers to a SaaS sales metric that refers to customers that cancel or downgrade their subscription or involuntarily cancel their subscription due to a missed or failed payment.
This is how it is measured –
- Find the tidal number of subscribers at the beginning of a period. Thirty days would be an excellent period to go with.
- Subtract the total number of subscribers at the beginning of a period with the total number of subscribers at the end.
- Divide the result of step 2 by the total number of subscribers at the beginning of the period.
ARPU
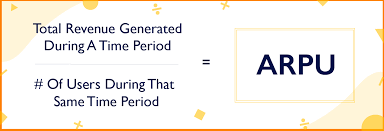
ARPU (Average Revenue Per Customer) is a critical SaaS sales metric to measure. ARPU gives us the amount of money a company may expect to earn per customer/user. This metric is vital for salespeople mainly because it gives them an idea of their customer’s spending habits. To calculate ARPU, divide the MRR by the number of active customers.
SaaS Conversion Rates

In terms of SaaS metrics, conversion rates are indispensable. They give you valuable insight into how well your website has been optimized to persuade visitors to purchase. It may give you a more holistic understanding of your product or service’s efficacy and how much value your target audience can derive from it. It may also help you compute your ideal SaaS pricing. Here are a few critical SaaS conversion rate measurements.
Base Conversion Rate
Using Google Analytics, you can easily find your SaaS conversion rate, but you may also calculate it manually if needed. The SaaS conversion rate may be calculated by taking the total number of website visitors and dividing it by the total number of conversions. For instance, if your site has 500 visitors a month and 125 sales, your conversion rate is 4\%. That is the base conversion rate. There are many ways to measure your SaaS conversion rate to give you a better picture of what is happening with your website’s buyers.
Lead to Sale Conversion Rate
The SaaS marketing department is responsible for getting leads, which they do through advertising, lead fill forms on websites, organic search, content marketing, social media, and more. When those leads get obtained by marketing, they get filtered through to the sales team. Qualifying and assigning leads to specific salespeople via a CRM like Salesforce or other systems is usually done by an automated process. You may want to measure your sales team’s effectiveness at converting leads into paying customers once they obtain some leads. Here’s where the Lead Sale Conversion Rate comes into play. One easy way to calculate the Lead to Sale Conversion Rate is to take the total number of new customers for a particular period and divide that number by the total number of leads for that same period.
Lead Source
You might also want to know where your best leads are coming from. Hence it is vital to track the source of your leads via a tool like Google Analytics and/or Semrush or Ahrefs. Using these tools, you may track the source of your leads so you know whether they’re coming from organic search, advertising, or social media. After getting the numbers behind your leads, you may use the same Lead to Sale Conversion Rate calculation to determine where your best leads are coming from. To determine the lead-to-sale conversion rate, divide the number of new customers by the total number of leads and multiply the result by 100. Many automated tools can track all this data, so you don’t have to manually calculate anything. CRMs like Salesforce can compute these calculations. You may also use standalone tools like Ruler Analytics.
Typical SaaS Customer Life Cycle

CLV or Customer Lifetime Value estimates how much money a customer may generate for your business for the duration they’re associated with it.
CLV is calculated by the average purchase value multiplied by the purchase frequency rate multiplied by your average customer lifespan. Computing CLV is vital because it paints a picture of the value of your customer through their entire SaaS lifecycle. Additionally, it assists you in understanding how much money is worth spending to acquire a new customer.
SaaS Customer Acquisition Cost or CAC

It is essential to know the cost of acquiring new customers. The formula is quite simple.
Total sales and marketing spend/total number of customers acquired = CAC. Suppose you spend $30000 on sales and marketing efforts over 30 days. Simultaneously, you acquire 250 new customers. Your total CAC would then be $120. There are other calculations when it comes to SaaS CAC that you need to remember.
Months to Recover CAC or the CAC Payback Period – This refers to the months it takes to generate revenue to cover the cost of customer acquisition. To calculate this metric, take your CAC and divide it by your average MRR, and multiply that result by your Gross Margin Percentage. The months to recover the CAC formula would be
CAC / Avg MRR * Gross Margin \% = Months to Recover CAC
Gross Margin – This is a calculation of your business revenue less the cost of business operations for each department in your firm. A gross margin calculation would look like this.
Total Revenue
- Support
- Services
- Customer Success
- Dev ops
= Gross Margin
CAC: LTV – This ratio is the lifetime value of your customers and the amount you spend to acquire them. Focusing on this metric can tell you how efficiently you acquire new customers. A CAC to LTV ratio of 1:1 means you’re breaking even. Anything more than 1 for the ratio numerator means that an existing customer is more valuable than the cost needed to acquire a new one. Calculate your CAC to LTV ratio in 3 steps.
- Find your CAC with the formula: Total sales and marketing spend/total number of customers acquired.
- Find out your customer LTV. You may calculate your customer LTV using this formula: Average purchase value X Purchase frequency rate X average customer lifespan.
- Take the numbers you get from the above two steps and divide the larger one by the smaller one to arrive at the ratio.
What is an ideal CAC to LTV Ratio for SaaS companies?
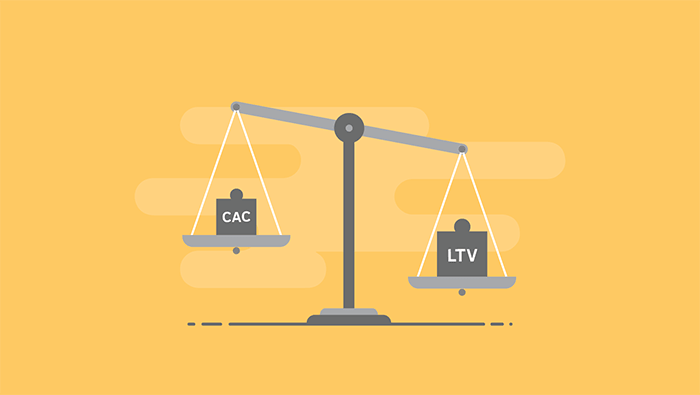
An ideal CAC: LTV ratio is usually anything more than 2:1. As the first number in the ratio increases, the better your CAC to LTV ratio is. 4:1 is considered an ideal ratio for this metric.
Customer Engagement Score – CES
CES measures how engaged your customers are with your software or a brand. It is not a financial metric, yet it is extremely important. Think of how your customers regularly interact with your brand – on social media, logging into your software daily, leaving reviews, attending webinars and other events, and more. A customer who does even a few of these things is less likely to leave, values your product, and is likely to become a long-term customer. Even though we cannot give customer engagement a specific monetary value, it is clear that it affects bottom line financial metrics with monetary value, so customer engagement is essential.
Calculating Customer Engagement
There is no standardized formula for calculating CES, so you must keep track of customer events that make sense for your business. Here’s what it may look like
- Active users over time.
- Site visitors- how many users visited your website and when (in Google Analytics, this may be Pages per Session, Average Session Duration, and Bounce Rate).
- Social media metrics like likes, reach comments, shares, and clicks.
- Daily software logins
- Usage milestones (For example, creating a landing page, completing the onboarding process, gathering 500 leads, etc.
Certain customer events may have more engagement importance than others, so one way to visualize engagement importance is to assign any value to a customer event, such as 1-10 (with one being the least and ten being the most important). After assigning a value to a customer event, you may use a simple formula to calculate the engagement score.
Customer engagement score =(w1xn1)+(w2xn2)+(as many events as you may need)
“W’ refers to the weight you have assigned to a customer event (from 1-10), with “n’ being the number of times that event occurred.
Conclusion
If you are running a SaaS business, reporting on specific SaaS metrics is very important to ensure your business stays profitable. Online business is so fast-paced that it is easy to get lost in the flow and trapped in a cycle of continuous work without taking the time to analyze actual numbers. Make time to do SaaS reporting, even executing fewer tasks, and watch your business flourish with time.