Social platforms have become an integral part of every business venture today. From Facebook to Twitter to YouTube to Instagram, businesses are leaving no stone unturned to promote their products and services. In this post, we will dive deep into the world of YouTube and how you can better optimize your video content on this popular social platform.
When it comes to using YouTube for business purposes, it is not sufficient just to put up your video content on a regular basis and promote it on other social platforms. The key to ensuring that your YouTube videos are performing well and reaching the right audience is to understand and analyze the analytics and metrics. In this post, we will take a look at what exactly is YouTube analytics, why is it important, how to access the analytics, and what are the different metrics, and how to analyze the metrics to better optimize your video content.

Table of Contents
What is YouTube Analytics?
YouTube Analytics is essentially the backbone of your YouTube channel. This section allows you to take a look at what is working, how well is something working, why is something not working out, and more. Using the YouTube analytics, you can determine and understand several important information, such as:
– What kind of engagement do your videos have?
– How to analyze the likes, dislikes, comments, etc., on your videos?
– Who are your audience and what do they like to watch?
– Why do your videos have no engagement?
Whether your video has thousands and millions of views or just a couple of them, it is crucial for you to understand the analytics so that you can either improve or continue doing what you are doing good. If you are a newbie in the world of YouTube analytics, it can be really overwhelming to look at such vast data. However, by the end of this comprehensive guide, you will have a fair idea of what metrics to look for and how to analyze them in order to meet your marketing goals.
Why is it important to understand your YouTube Analytics?
Video content is one of the most powerful marketing tools used by businesses. It is a great way to attract and retain the attention of your intended audience and convert them into positive sales. Today, the competition on YouTube is quite aggressive, and you really need to step up to stay ahead of your competitors. One of the best ways to surge ahead and create effective marketing video content is to analyze and understand your YouTube Analytics. This will enable you to:
– determine which of your video are best in performance with regards to number of views, watch time, and engagement.
– determine what type of content to focus on so that you can garner more audience attention and engagement.
– determine how factors, such as video title, duration, thumbnails, etc., have an impact on the performance of your videos.
Ideally, you will be able to use your YouTube Analytics to create and develop better and effective video marketing campaigns.
When you access the YouTube Analytics page, you will see tons of metrics which can surely leave you confused and overwhelmed. Hence, we have listed down the top-most metrics that you should pay attention to so that you can create amazing video contents.
How to Access YouTube Analytics?
Before we get to those important metrics, let’s take a look at how you can access the YouTube Analytics page.
1. The first step is to log in to your YouTube account.
2. On the upper right corner you will see the profile icon. Click on the icon and then select YouTube Studio as shown in the below image.

3. On the left side you will see multiple options for your channel. Select the option Analytics.

4. As you can see, there are four main tabs – Overview, Reach, Engagement, Audience, and Revenue.
5. For a complete breakdown of your channel and video analytics, click on the Advanced Mode option on the top right corner. You can download these reports either in .csv format or as Google Sheets.
If you wish to compare between videos or growth of your channel o a year-on-year basis, you can select the Compare To option from the Advanced Mode. You can also access YouTube Analytics on your mobile device by following the below steps:
1. Open the YouTube app on your phone and select the profile icon on the top right corner.
2. Select and download the YouTube Studio app.
3. Sign into your account on the YouTube Studio app.
4. On the Dashboard menu, you will find the Analytics option.
5. Click on View More and you will find the options – Overview, Revenue, Discovery, Audience, Interactive Content, and Playlists.

Understanding and Analyzing the Metrics
As mentioned earlier, there are tons of metrics available for analysis; however, you don’t really need to look at each one of them. Here are the top eight metrics that needs your attention in order to help you create amazing and effective video marketing campaigns.
1. Watch Time
When we talk about videos on YouTube, a lot of importance is given to the number of views received. Though this is important, you also need to pay attention to Watch Time which is the approximate time people spent viewing your video. Using this metric, you can evaluate and forecast your video’s performance. A higher watch time will rank your videos higher in results and recommendations.

2. Audience Retention
Audience retention is a critical metric which helps you to understand which part of your video was engaging and which was not. Holding your viewer’s attention is important for the success of your video. Using this metric, you can analyze the quality of your video, improve the areas where audience retention is less, and duplicate the sections that worked well in other videos.
3. Audience Demographic
One of the best ways to ensure that your video marketing content is a success is to ensure that you are targeting and reaching the right audience. You can use the demographic metrics to find out about your audience’s age, gender, location, device, etc. These details can help you to create more effective and engaging video marketing content.

4. Traffic Sources Report
In order to understand the reach of your videos, you can use the Traffic Sources Report metrics. Using this metric, you can find out how your audience is finding your content – is it through direct search on YouTube, clicking on recommended videos thumbnails, accessing via social networks, etc. This will allow you to focus more on traffic sources that are performing well and avoid wasting time on those that are not performing well. You can access this metric under the Reach tab.
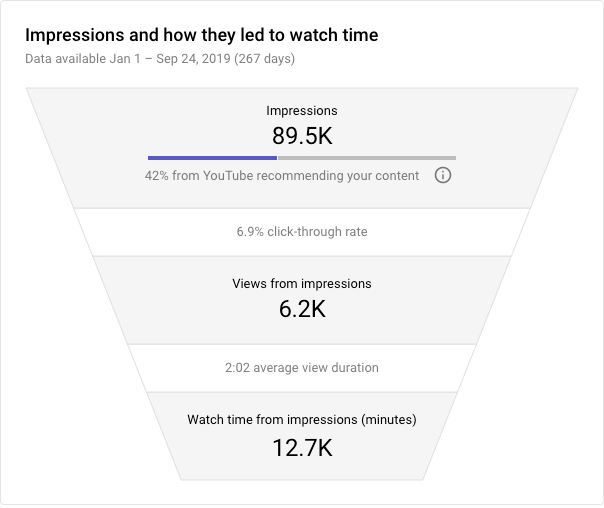
5. Impressions Click-Through Rate (CTR)
When your video thumbnail shows up on a user’s YouTube homepage, it is known as an impression. The data on impressions click-through rate gives you the percentage of how many impressions translated into views. A higher click-through rate indicates that you have a good title and attractive thumbnail. This metric can also help you understand whether your video was able to keep your viewer’s attention.
6. Card Click-Through Rate
Cards are a form of call-to-action. These are slide-in panels which motivate the viewers to take an action while viewing a video, such as subscribing to the channel, liking the video, watching another video, access a different website, etc. Through each of these card click-through rates, you can determine your viewer’s preferred action. By analyzing this metric, you can gain better understanding of what cards to place, when and where to place them, what should be the duration of the card, and more.
7. Real-Time Report
Real-Time Report is one of the most useful YouTube Analytics metric. This metric allows you to evaluate your videos as soon as you post them. You can view the real-time report for your entire channel and specific videos as well. The time slot is between last 48 hours to last 60 minutes. You can use this metric to analyze various factors, such as when was there a spike in your views, the reason behind the spike, how you can use this information to further optimize your videos, etc.

8. Likes and Dislikes
It is obvious that your likes and dislikes are the most common indicators of how your video is being received by the audiences. What you need to pay attention to is definitely the dislikes. Though having dislikes on your videos is common, you need to use it to find out the reason behind it. There can be several reasons, such as have you used the apt title and thumbnail for your video, is your video content relevant for the intended audience, is the video quality good, etc. Checking your comments section is also a great way to find out why viewers have disliked your video.
Apart from these eight metrics, there are several other metrics as well which can be analyzed using the YouTube Analytics, such as:
– Social Shares
– Subscriber Rate
– Unique Viewers
– Playlist Engagement
– Subscriber Growth
– Keywords
Conclusion
There is no doubt that video marketing strategies are here to stay and YouTube being the world’s second most browsed website, is the ideal platform to host all your video content. Using YouTube Analytics will enable you to better use the platform, optimize your video content, and gain maximum results out of your YouTube videos.


