The digital entertainment landscape continues to evolve, 2025 promises to be another groundbreaking year for streaming platforms. With the rise of innovative content, cutting-edge technology, and shifting viewer habits, the streaming industry has firmly established itself as a dominant force in global entertainment.
This article dives into the most compelling streaming statistics of 2025, offering insights into audience preferences, platform performance, and industry trends shaping the future of entertainment. Whether you’re a content creator, marketer, or avid streamer, these statistics will provide valuable perspectives on the state of streaming in 2025.

Table of Contents
General Music Streaming Statistics
-
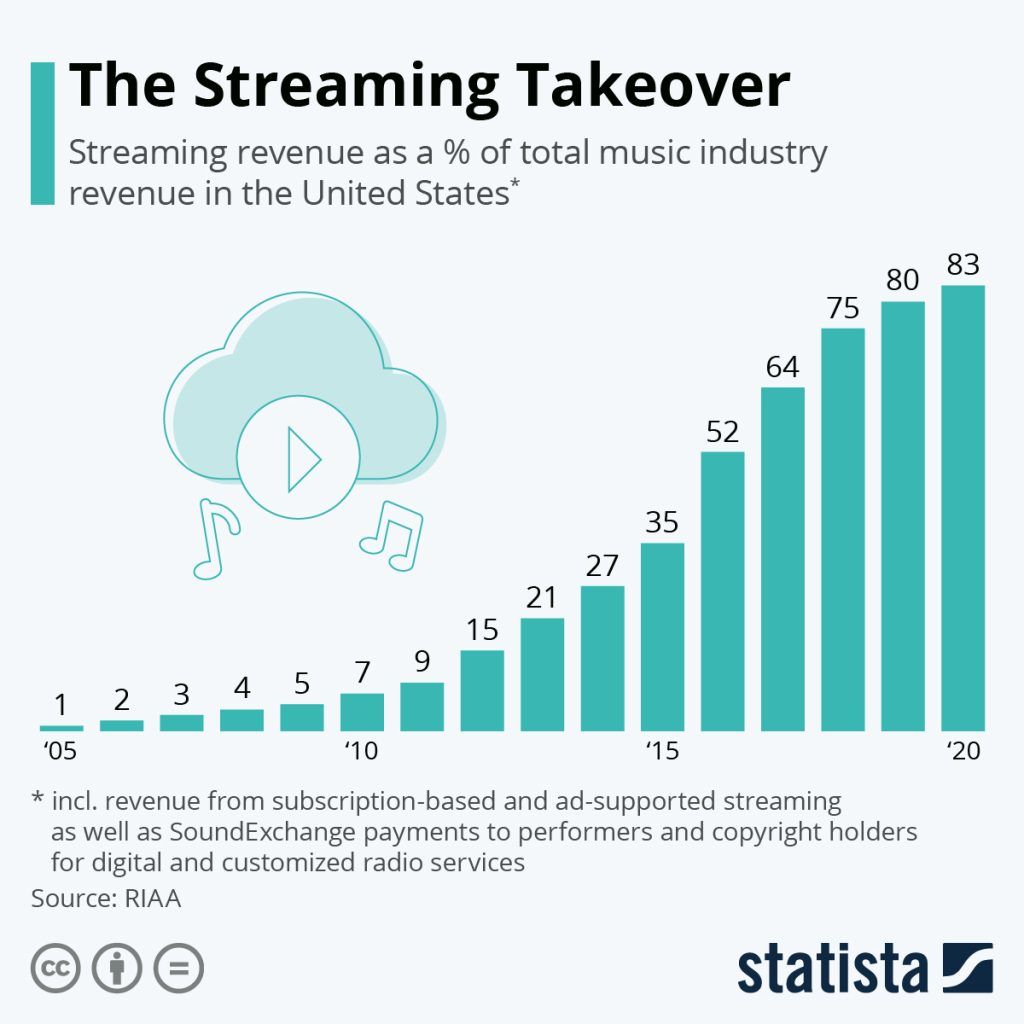
Music Streaming’s Share of Industry Revenue: As of 2023, music streaming accounts for 89% of total music industry revenue, highlighting its dominance in the market.Exploding Topics
-
Digital Music Users in the United States: In 2023, there were approximately 288.8 million digital music users in the U.S., with user penetration projected to reach 77.3% by 2025. Statista
-
SoundCloud’s Platform Statistics: As of 2024, SoundCloud hosts over 202 million tracks, with an average of more than a million new tracks uploaded monthly. Music Business Worldwide
-
Library Sizes of Major Streaming Services: Amazon Music offers a library of over 100 million songs as of 2025.Yaguara
-
Subscriber Numbers:
- Spotify: As of 2025, Spotify has 640 million monthly listeners.
- Apple Music: There are 32.6 million Apple Music subscribers in the United States.
- Amazon Music: Amazon Music has more than 80 million subscribers as of 2025.
-
Global Music Streaming Volume: In 2023, approximately 7.1 trillion songs were streamed globally, marking a 33.7% increase from 5.3 trillion in 2022.Tone Island
-
Growth in On-Demand Audio Streams: From 2017 to 2023, the number of global on-demand audio streams increased from around 950 billion to 4.1 trillion, representing a growth of over 400% in six years.Tone Island
-
Consumer Preferences in the U.S.: A significant portion of U.S. digital music users prefer Spotify, with 43% actively using the service.The Social Shepherd
-
Market Growth Projections: The music streaming industry is expected to grow from $33.23 billion in 2024 to $37.18 billion in 2025, at a compound annual growth rate (CAGR) of 11.9%.The Business Research Company
Music Streaming and Monetization
- Digital Music Subscription Revenue: The current global digital music subscription revenue stands at $13.3 billion.
- Growth of Streaming Revenue: Streaming revenue increased by 51% in 2023, while download and physical revenue continue to decline.
- Paid Music Streaming Usage: Around 25% of the global population uses paid music streaming services daily.
- Revenue Breakdown by Region:
- Europe: Paid subscriptions account for 72% of digital music revenue.
- US: Paid subscriptions make up 56% of digital music revenue, up from 47% in prior years.
- Key Features Consumers Value:
- 80% of users prioritize a variety of music and affordable pricing.
- The least important features remain curated playlists (48%) and artist exclusives (43%).
- Best Platform for Artists: Napster continues to lead in payouts, offering $0.019 per play. Artists need 77,000 streams to meet the US minimum monthly wage of $1,746 (2025-adjusted).
- Share of Revenue from Streaming: Streaming accounts for 65% of global music industry revenue, up from 38% in 2017.
Podcast Streaming Statistics
- Podcast Audience:
- Regular podcast listeners in the US have grown to 104 million.
- 60% of podcast listeners are male.
- Global Reach: Podcasts are available in 120+ languages.
- US Online Audio Trends:
- 91% of Americans aged 12-24 have streamed online audio.
- Over 210 million Americans have listened to podcasts.
- Listening Behavior:
- 55% of listening happens at home, followed by 25% in cars.
- Weekly podcast listeners are now at 82 million people.
- Around 18 million people in the US identify as avid podcast fans.
- Device Trends:
- Smartphones remain dominant for podcast consumption, with 59% of listeners using iPhones.
- Podcasts account for 30% of all audio content in cars.
- Revenue Growth: The US podcasting industry reached $2.2 billion in revenue in 2024.
General Video Streaming Statistics
- Digital Video Revenue: Estimated to reach $17.8 billion in 2025 globally.
- Penetration in the US:
- 50% of US households now subscribe to at least one streaming service.
- Around 62% of Millennials and Gen Z stream videos daily.
- Market Trends:
- The global video streaming market is projected to be $136 billion by 2025, with a CAGR of 12%.
- 45% of US consumers have both streaming and cable TV services.
- Binge-Watching Habits:
- Millennials and Gen Z binge-watch an average of 8 episodes in one sitting, while Boomers average 5 episodes.
- Cord-Cutting: Over 30% of US households no longer have cable TV, relying solely on streaming services.
Live Streaming Statistics
- Rise in Live Streaming: From 2022 to 2024, there was a 96% increase in live video viewership globally.
- Popular Live Content:
- Breaking news (60%) and behind-the-scenes access (88%) are the most-watched categories.
- Live Video Impact on Purchasing: 70% of live viewers are more likely to buy event tickets after seeing live videos.
- Preferred Platforms: YouTube Live remains dominant, capturing 75% of live-stream viewers.
Video Streaming Platform Usage
- Global Leaders:
- YouTube remains the most popular platform with over 2.6 billion users globally.
- Netflix leads the paid subscription market with over 250 million subscribers worldwide.
- Library Sizes: Amazon Prime still boasts the largest streaming library, with over 40,000 movies and shows.
- US Popularity: Over 65% of Americans rely on streaming services for entertainment, with Netflix and Hulu as the top choices.
Mobile Video Streaming Statistics
- Global Trends:
- Non-gaming video streaming apps earned $29 billion worldwide in 2024.
- Time spent on video apps increased by 170% between 2018 and 2025.
- Regional Patterns:
- Indian consumers now watch over 70 billion hours of app-based streaming annually, surpassing the US.
- South Korea continues to lead per-capita viewing, with 2,500 hours per person annually.
Wrapping Up
The uses of streaming services may be obvious at first glance, but a lot of important insights can be gained if we dive deeper into this medium. Try to turn this information into something you can use to leverage the constantly growing power of streaming services. If you are looking at reading more such Statistics articles, check out our Statistics blogs here!