Scanning plenty of time management data will help you realize the amount of squandered time every day. A study conducted in the UK reveals that an average individual spends more than two hours a day doing nothing.
Considering this ‘nothing’ could be used up for ‘something,’ we label it under uselessly squandered time. And if you think this is crazy, wait till you go through all the time management studies conducted and represented info graphically.
Table of Contents
Why are Time Management Statistics essential?

From a general standpoint, time is essential to everybody, be it an employer, employee, student, or independent individual. Everybody needs to manage time in order to stay productive and achieve what they plan on.
However, large amounts of time are wasted every day, and this misuse of time can only be managed via real-world data. Real-world data on time management spring up ideas on staying productive and reducing the amount of time squandered every day. Moreover, wasting your workplace time can blight your leisure time as your work directly impacts your routine.
So managing your time will not only put you in a professionally stable place but also let you have your leisure hours peacefully.
So here are some time management statistics that might blow your mind.
Some Time Management Statistics you should know
Here is a list of some very intriguing statistics that are meant to astonish you.
- As per the 2021 time management statistics, the logging and the mining staff spend 44 hours of their week working.
- Statistics during the Coronavirus stated that the workplace-personal life balance of almost 60 percent of employees was significantly affected.
- Only 17 percent of the entire population track their working time.
- Business owners spend about a quarter of their entire workweek dedicated to accounting.
- As per the 2021 study, the average US workweek for full-time employees was estimated to be 41.5 hours.
- 44 minutes of work hours are spent on social media every day.
- A study revealed that 87 percent of the students could do much better academically if they were more organized.
- The keyword ‘Employee Monitoring’ had an interest value of 100 by the end of 2020.
- About 46 percent of the total workplace stress is caused by burdening workload.
General Statistics on Time Management

Statistically, an average human being spends 26 years of their life sleeping. Apart from that, 13 years of our lives are recorded as work time.
Observing these statistical patterns, we can conclude that setting goals can help an individual optimize their day.
Here are some general time management statistics that might interest you:
- 22 percent of students saw an academic improvement by setting their goals.
As per time management statistics, 2 out of 10 students who dedicated themselves to goal setting recorded an improvement in academics. On the other hand, the other 88 percent who overlooked the importance of setting goals recorded little to zero academic improvements.
- Industrial employees worked the most throughout 2020
The recent 2021 study estimated that the people engaged in the industrial sector worked the most, with an average of 9 hours a day.
This was followed by the employees in the utility sector who dedicated 42.9 hours of their week to work.
Lastly, the hospitality staff worked the least by investing only 25.2 hours a week to work.
- Cutting work hours can increase productivity
75 percent of the US employees work 44 hours per week. However, the COVID-19 burnout resulted in the decline of workplace productivity as employees failed to balance their work and personal life.
Consequently, people were forced to work more than medically recommended work hours. This resulted in working imbalances.
Some companies reduced their workdays to 4 days a week and recorded positive results on the flip side.
- Employee Monitoring was the most searched keyword in 2020
By the end of December 2020, the term ‘Employee Monitoring’ recorded an interest value of 100. This shows how employers were keen on determining the work productivity of their employees. This could be due to shifts in the workplace environment due to the COVID-19 situation.
Now that the general statistics are covered, let us target some specific areas.
Workplace Time Management Statistics
Despite the fact that average working week hours cross 40, there are instances of sheer time wastage at a workplace. This time wastage could be reasoned with:
- Procrastination
- Futile meetings
- Pointless paperwork
- Disorganized database

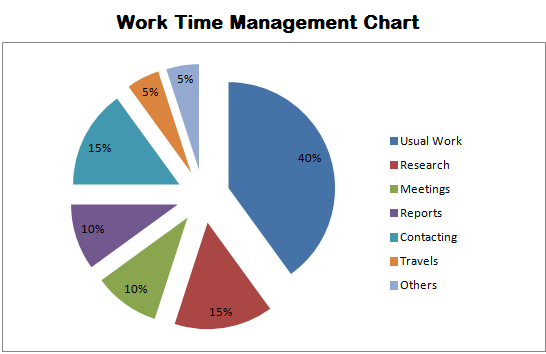
Here is an illustration of how time is squandered at a workplace
- Senior designated employees spend around 23 hours per week on pointless discussions and meetings
Workplace meetings could be futile if they fail to complete an agenda. As per statistics, the time wasted on meetings doubled between the years 1960 and 1980.
Therefore before accepting any sort of workplace meeting, assure that they are genuine and hold any value to your work. If not, then it would be best if you opt-out.
- 11 percent of the enterprises admitted to being horrified of accounting tasks
A time management study for 2021 documented that 2 out of every business organization was terrified of the accounting work. Some of the organization employees addressed their sleeping issues due to the accounting tasks.
This whole situation is a blatant explanation of how stressful work can affect an individual’s well-being and overall performance.

- Nearly 16 days out of the entire year are wasted over paperwork
Although digitalization has conquered the world and continues to do so, some companies still stick to the obsolete database recording methods. These methods include complex and lengthy paperwork, which extracts a significant amount of time from an organization’s productivity.
- On average, a regular UK employee wastes 2 hours 11 minutes a day procrastinating
A clear account regarding employee procrastination can be:
- Social media: 16 minutes
- Indulging in Personal Thinking: 20 minutes
- Texting: 28 minutes
- Gossiping: 18 minutes
Statistics concerning the education system
- Students need to invest 20 hours per week to study
It is often observed that 8 out of every 10 students fail to organize their study schedule. This results in students pulling all-nighters during the exam periods.
Therefore, in order to avoid study burnouts, a student should dedicate 20 hours a week to their study. These 20 hours can be broken up as:
- 15 hours in class
- 5 hours of self-study
- 87 percent of the students could excel academically if they managed their time
50 percent of the students admitted that they make no use of any system to organize their lecture notes, assignments, and study hours.

This is the sole reason why they struggle during their exams. A lack of proper organizational skills is what puts a student in a bad place during semester ends.
- Almost 60 percent of the working hours of a teacher are spent out of classrooms
Teachers spend significantly fewer hours teaching due to the current schooling system. Considering breaks, idle periods, the time between classes, and other activities, it could be stated that teachers spend significantly less of their working hours actually teaching.
Wrapping up
Thus, it could be concluded that happy individuals augment the production rates of an organization. In fact, an organization with more Workforce Happiness Index tends to do 31 percent better. Therefore, keeping employees busy and happy can lead to a business’s success and increase sales by 37 percent.


