Correlation and regression are often heard terms in business discussions that involve data analysis and truth-finding. But what exactly are they?
These are statistical measurements that connect two variables and help predict outcomes when either of the variables changes. Admittedly, many a time, the two are incorrectly interchanged.
For example, while forecasting demand for apparel, retailers often used historical data to predict demand. In the process, they try to establish a connection between demand and various factors like seasonality, trends, macroeconomic factors, competition, and others. Some of it would require correlation analysis, while others need a regression analysis. But one is likely to hear the word correlation more than regression in such discussions. However, these two are different words with different meanings.
Table of Contents
So, what’s the difference between the two?
Broadly speaking: correlation measures the degree of relationship between two variables, whereas regression tells us how one variable affects the other.
Correlation tells us how much of an impact seasonality has on demand. Regression can help us predict demand when a new competitor sets up a shop in the neighborhood.
Let’s dig in deeper to understand this better.
What is regression?
Regression helps establish the cause-and-effect relationship between a set of variables and an outcome. It could be a change in one or more variables that alters the outcomes. Through a regression analysis, one can zero in on the variables, and predict the amount of change that impacts the result.
Depending on the type of analysis required, there are various types of regression analysis methods. We have listed a few of them for you here.
Types of regression
1. Linear regression: It is the most intuitive form of regression analysis. Linear regression is where the relationship between input and output is a straight line. It could have single or multiple variables.

Linear regression helps in establishing relationships without too much data. However, this simplicity also makes it sensitive to outliers.
2. Polynomial regression: When you have multiple variables affecting an outcome to a varying degree, you assign a different power to each of them. The result is not a linear line but a curve that varies according to the variable’s influence on the outcome.
y= a(x_1)^1+b(x_2)^2+c(x_3)^3+…. +z
where x_1, x_2, x_3 are variables.
![2: Part (a): Represents linear regression on a one-dimensional data [17]. Part (b): Represents polynomial regression (degree 2) on same data [17].](https://www.researchgate.net/profile/Manish-Kukreja/publication/320609829/figure/fig2/AS:631627428413442@1527603122071/Part-a-Represents-linear-regression-on-a-one-dimensional-data-17-Part-b.png)
In the above image, (a) represents linear regression and (b) polynomial regression on the same data set. As is evident, a polynomial regression better captures causality in complex input-output relationships. However, its accuracy depends on assigning the correct exponents. It demands the modeler to have a good understanding of data and underlying nuances.
3. Ridge Regression: With high collinearity among independent variables, or high pairwise correlations, a linear or polynomial regression will not help. Think of it as the variable that itself is a product of many others. Deleting a feature variable, therefore, results in a dramatic change in regression coefficients. Collinearity, therefore, lends a certain rigidity to the model to reduce high variance.
Ridge regression adds a minimum squared bias factor to the variables to alleviate rigidity. Even with the addition of a small bias, the result is more accurate. Understandably, one cannot assume normality.
4. Lasso Regression: It is similar to Ridge regression, where the addition of a biased term optimizes the regression model. The only difference is it uses an absolute value and not a squared one.
5. ElasticNet Regression: When you combine Ridge and Lasso regression, you have an ElasticNet regression.
Without getting into too many technical details, we can group the last three – Ridge, Lasso, and ElasticNet – as regularization regression models. These models help us optimize models where variables have multicollinearity and high dimensionality.
Applications of regression
One of the most popular uses of regression in business is to measure the advertising impact on revenues.
Revenue= (revenue with zero advertising) + β (ad spends)
A negative β implies that an increase in ad spend will lead to a decrease in revenues.
Admittedly, the above example is a simple one. Similarly, a regression can establish causality of various outcomes in health, agriculture, finance, and other sectors. Agriculture scientists, for instance, use regression to find the relationship between irrigation, fertilizers, and crop yield. Likewise, in health sciences, researchers use regression to study the causality of various health conditions, which often involve many variables.
What is correlation?
Simply put, correlation is the connection between two variables and how they move – both in terms of magnitude and direction.
For instance, the lower the temperature drops, the greater is the sale of winter wear. Another example is demand and price. If the demand for a product X goes up, the number of people willing to pay also does. Consequently, the prices also go up.
Positive and negative correlation
In a positive correlation, both variables move in the same direction (like demand and price in the above example).
If the demand shrinks with the price increase of product X, then it’s called a negative correlation. Here the variables move in opposite directions.
The value of the correlation coefficient thus moves between +1 and -1. These are coefficient values for perfect positive and negative correlations, respectively. A value of zero indicates a weak correlation.
Types of correlations
Four different types of correlations exist in statistics:
1. Pearson correlation: It establishes the strength and direction of a linear association between two continuous variables. The emphasis here is on linear and continuous – it could be an interval or ratio.
A scatter diagram can help establish the linearity of the variables.
In a Pearson correlation, you start with a hypothesis – say, lower the temperature, higher is the sale of ice creams.
The strength of the coefficient is denoted by r.
2. Kendall Rank correlation: When data you are working with fails the one or more assumptions of Pearson’s correlation, a Kendall Rank correlation is an alternative to explore. It tests the strength and direction of data when ranked by quantities. The data could be ordinal (or non-numeric) or continuous. An example of non-numeric data could be customer satisfaction levels – very satisfied, satisfied, neutral, unsatisfied, very unsatisfied.
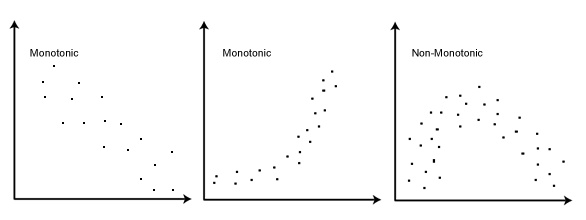
3. Spearman correlation: It is a non-parametric version of Pearson’s correlation. Spearman’s correlation coefficient (ρ) measures the strength and direction of the monotonic relationship between two variables. A monotonic relationship is one where both variables move in the same direction. It is different from a linear relationship, used by Pearson’s correlation, where the direction could be the same or opposite.

Application of correlation
Correlation analysis in business helps in planning and improving outcomes. For example, it can improve customer satisfaction by identifying the impacting variables.
For an e-commerce business, a correlation analysis could determine if customer satisfaction is impacted more by delivery time or a shipment tracking feature. Based on the insight, the businesses could prioritize improvements in their operations and tech stack.
Regression versus correlation – which one to use?
Regression and correlation are two different types of analyses serving two distinct purposes. Following are the similarities and differences between the two.
Similarities
1. Both work towards identifying the strength and direction of the relationship between different variables.
2. When the correlation between two variables is negative, the regression slope is also negative.
3. A positive correlation means the regression slope is also positive.
Differences
1. The main difference between regression and correlation lies in their ability to show causality. While a regression analysis concretely establishes the cause-and-effect relationship between two variables, correlation analysis cannot. Correlation merely recognizes how one variable moves when the other one is changed.
2. In regression, if a change in x leads to y, x is the cause, and y is the effect. Therefore, x and y cannot be interchanged. However, as correlation analysis focuses on the direction and magnitude of change, x and y can be swapped without repercussions.
3. Correlation is a single data point, such as ‘increase in temperature leads to grow of ice cream sales.’ A regression analysis, on the other hand, is an equation with changing values.
Sales of icecream= Usual sales + β (change in temperature)
Conclusion
The thumb rule for using regression or correlation analysis (when to use what?) lies in the purpose.
If you plan to use the analysis for planning, making forecasts, or predicting demand, always opt for regression analysis. It will offer you the insight required to drive specific outcomes.
Else, if the purpose is to only establish a relationship between two variables – either with or without a hypothesis – a correlation analysis is your best bet. If you have the hypothesis ready, Pearson’s correlation is the way to go. If not, a Spearman’s correlation analysis can help you in the case of monotonic relationships.
Regression and correlation are increasingly being used by AI systems to diagnose business challenges and also make forecasts. Armed with a basic understanding of how these work and the appropriate technology, you can transform the way your business works.
To make further sense of your data, you can use various data processing tools. You can also check out other software reviews and make a decision on which software is ideal for your business.


